Category: Stock Market
-
The Qullamaggie’s OXY Swing Breakouts

Featured Photo by @Nate_Dumlao at @unsplash This post was inspired by the Qullamaggie’s trading journey and its application to the TSLA swing breakouts. Read more about breakouts here. Our current goal is to extend the above breakout analysis to the $OXY stock. Motivation TradingView OXY Analysis: OXY advanced price chart: candlesticks, trading volume, Bollinger bands,…
-
Towards min(Risk/Reward) – SeekingAlpha August Bear Market Update
Featured Photo by Nick Chong on Unsplash Towards min(Risk/Reward) Let’s look at the latest SA market update as of Sun, Aug 21, 2022. Cryptocurrency Digest: As NFTs are increasingly recognised as assets, they also present a conundrum for the investment community. LTC has a robust and growing ecosystem. However, it is under pressure from competitors…
-
Zacks Insights into this High Inflation/Rising Rate Market

Zacks Insights into this High Inflation/Rising Rate Market: U.S. Recession Risk CPI/PPI Inflation Report Bear Market Strategy High-Risk Assets Profit from Dividends Focus on Quality International Stocks Market Volatility
-
The Qullamaggie’s TSLA Breakouts for Swing Traders

The content explains a Python-based stock scanner project that analyses TSLA’s historical data downloaded from Yahoo Finance. It applies a set of functions to identify stocks meeting growth criteria and checks for consolidation. The output is a series of plots showing original close price vs filtered data or breakouts. The scanner aims to help swing…
-
SeekingAlpha Risk/Reward July Rundown

Lets see what SA is up to in terms of Risk/Reward as of 2022-07-25: Cryptocurrency Digest: SA Morning Briefing: SPY: Overbought Demand Testing Resistance (Technical Analysis) Wall Street Breakfast: In arguably the most important week for Wall Street this summer, with the Fed decision and GDP on tap, earnings could actually end up determining direction. There are 175…
-
Zacks Insights into the Commodity Bull Market
Is there more meat on the commodity bone and how does one buy? The Case for Commodities Let’s summarize the recent Zacks insights (as of July 23rd, 2022) into the current commodity bull market: The best place to be when inflation hits is hard assets. Your house is one way, but a lot of other…
-
Macroaxis AI Investment Opportunity
The research presented examines the portfolio optimization potential of Macroaxis’ new artificial intelligence (AI) system. This tool automates processes like asset allocation, portfolio diversification and rebalancing, and equity research, providing a list of suggested investments. The AI makes suggestions based on market conditions and investor risk tolerance, and has demonstrated higher average returns than the…
-
Algorithmic Testing Stock Portfolios to Optimize the Risk/Reward Ratio
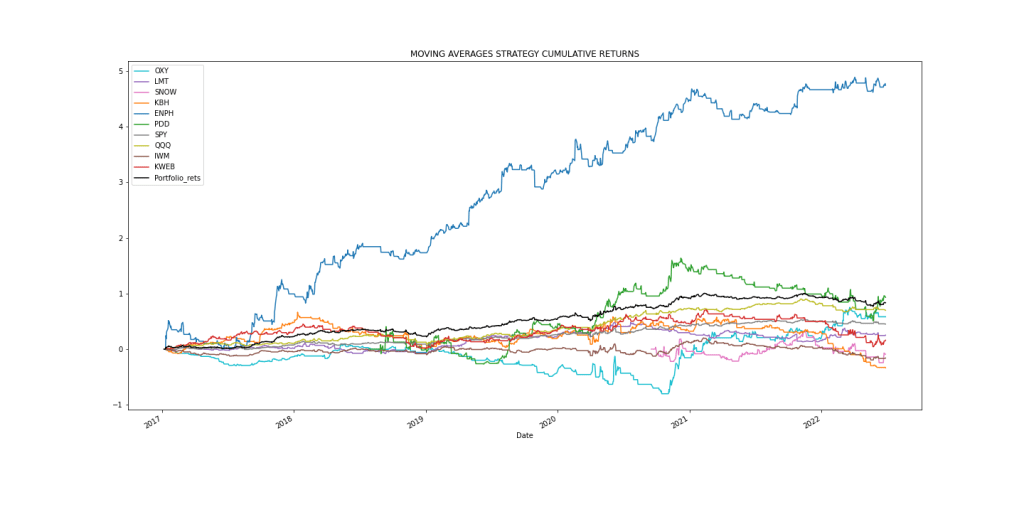
Investors can optimize their stock portfolio by invoking backtesting within the realm of algorithmic trading. The goal is to optimize the specific portfolio by maximizing returns and the Sharpe ratio.
-
Quant Trading using Monte Carlo Predictions and 62 AI-Assisted Trading Technical Indicators (TTI)
Algorithmic Trading using Monte Carlo Predictions and 62 AI-Assisted Trading Technical Indicators (TTI): The goal of the here presented pilot study is to develop and test an end-to-end Python-3 script in Jupyter that implements algorithmic trading. Thanks to high-level automation and integration of multiple tasks, the script can simultaneously analyze hundreds of technical indicators, run…
-
Are Blue Chips Perfect for This Bear Market?
12 High-Yield Blue-Chips That Are Perfect For This Bear Market TradingView Technical Analysis charts, trends, forecasts, oscillators, bias, volatility, risk management
-
Bear Market Similarity Analysis using Nasdaq 100 Index Data
We calculate similarities between the current market conditions and the selected six historical bear market events using the Nasdaq 100 Index Data. Results suggest that Covid19 pandemic, 1987 black Monday, and 1990 recession are closest to the current bear market.
-
Basic Stock Price Analysis in Python
Our basic stock price analysis in Python includes stock prices, stock volume, market capitalization, 50/200-day moving average, scattered X-plot matrix, and stock volatility or standard deviation.
-
Track All Markets with TradingView

Track All Markets with TradingView: getting started tips teaching a new dog old tricks making the most of your market analysis Global screener new features and more
-
S&P 500 Algorithmic Trading with FBProphet
We use Facebook’s Prophet to forecast S&P 500 stock adjusted close price. We plot the results simulating an initial investment of $1,000.
-
Predicting Trend Reversal in Algorithmic Trading using Stochastic Oscillator in Python

This is the example stochastic oscillator in Python for algorithmic trading $NVIDIA candlestick chart vs a stochastic oscillator chart over our trading period.
-
Stock Forecasting with FBProphet
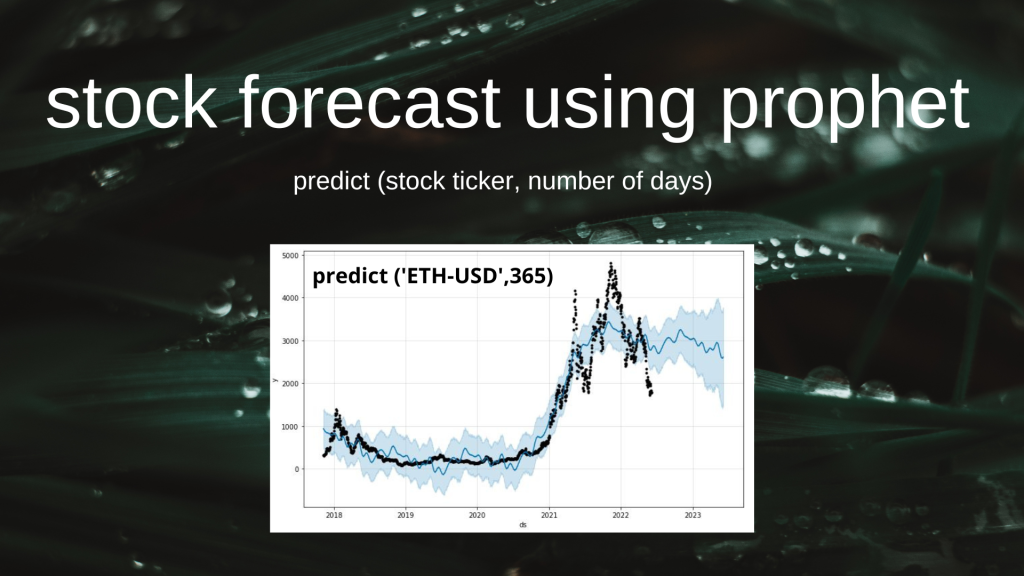
Prophet from Meta (Facebook) is a procedure for forecasting time series data such as stocks. Prophet is robust to missing data and shifts in the trend, and typically handles outliers well.
-
OXY Stock Update Wednesday, 25 May 2022
OXY Stock Update Friday, 20 May 2022 Energy Stocks Rebound Friday With 4% Jump in Crude Oil Prices Occidental Petroleum Shares Rise After Berkshire Hathaway Adds Stake in Firm TechView Opinion – BUY
-
Inflation-Resistant Stocks to Buy
Inflation-Resistant Stocks to Buy AAPL Example Python workflow Download 3 historical datasets – stock price and monthly/annual CPI Compute the monthly/annual stock performance (%) and CPI rate (%) Apply linear regression to the stock vs CPI performance cross-plot Check the slope or gradient of the linear trend – positive, negative or zero.
