
TradingView Insights 2 June 2022

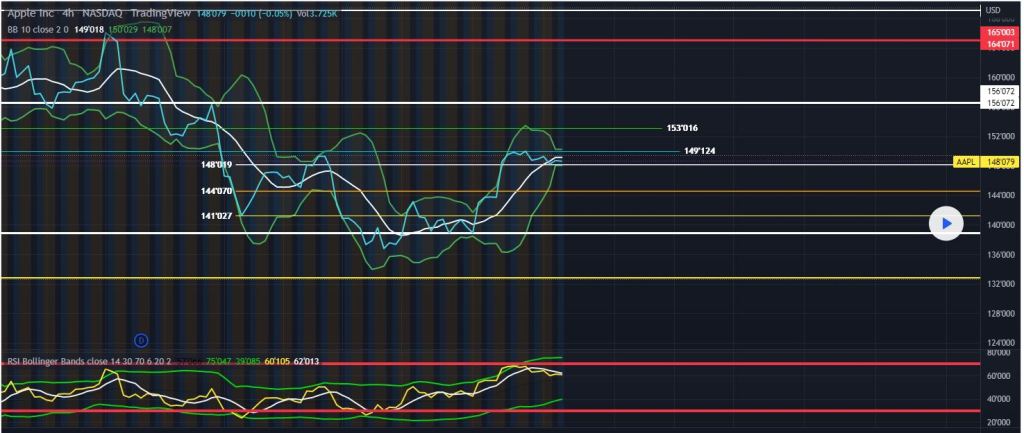
The Chaikin oscillator (see above) generates a bullish divergence when it crosses above a baseline. The baseline is called the accumulation-distribution line. A cross above that line indicates that traders are accumulating, which is typically bullish.

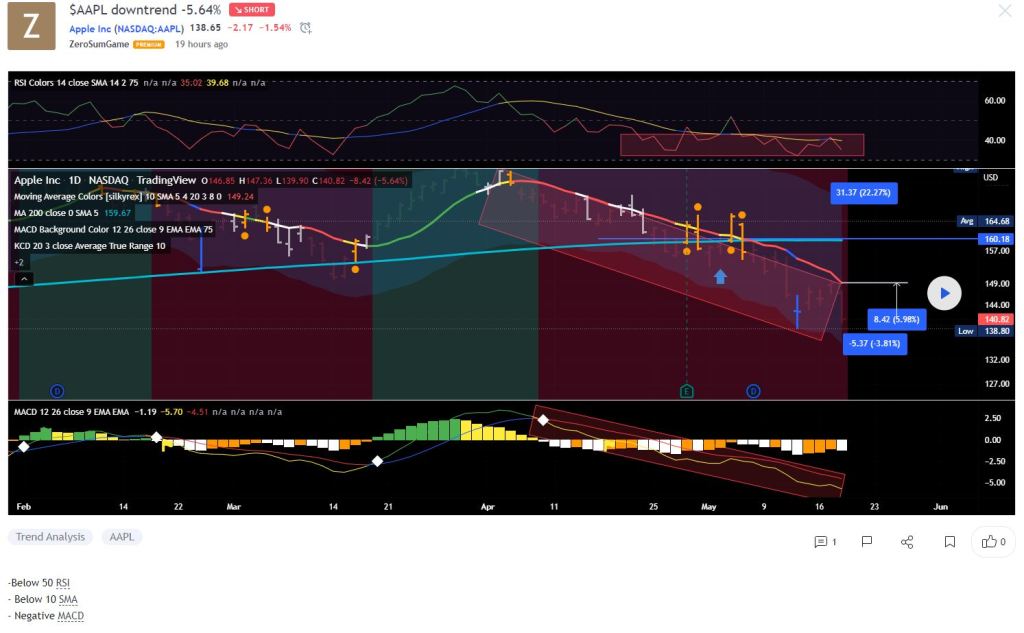
after having a strong break with a large candle we can take a sell position
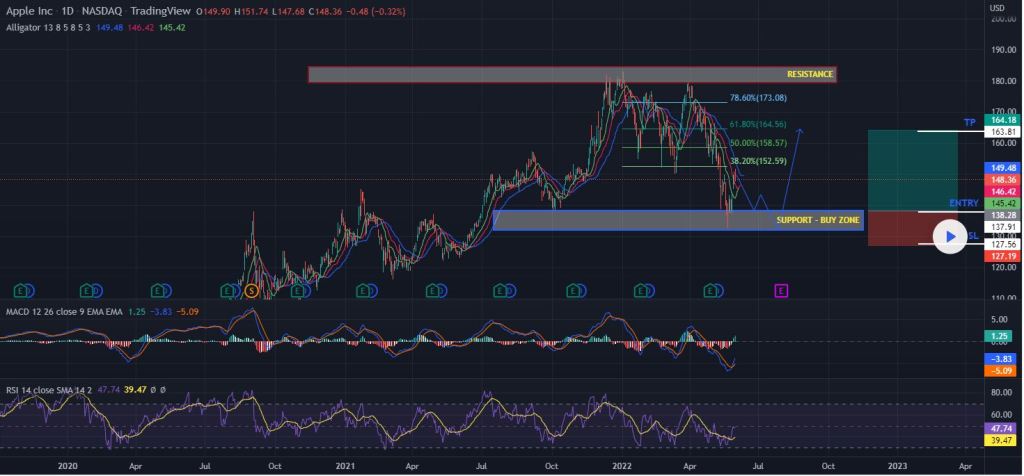
We are expecting the Price to fall below at our crucial support zone between 132$ and 137$ and then bounce back for a reverse of the trend.
MACD is already in a bullish momentum since lines crossed.
RSI looks positive
Williams alligator green line crossed with red. We need to see all lines cross for a buy signal.
June 01: I believe Apple will fall in the coming days, It couldn’t break $150, so down she goes.

May 31: AAPL interesting setup here, waiting for a confirmation move.
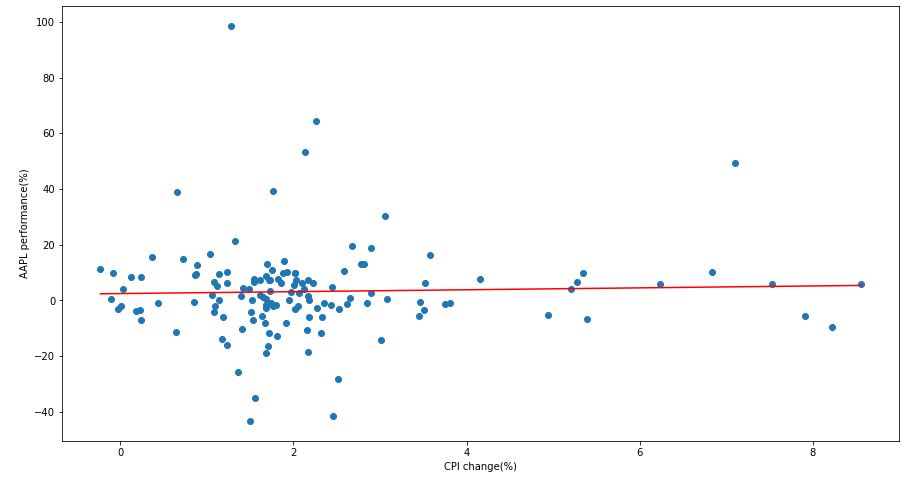
Both annual and monthly linear regression trends of the AAPl stock performance vs CPI change show a clear positive gradient. This means that this dividend stock is a good candidate for your inflation-resistant portfolio for reasons beyond its dividend. In fact, AAPL offers some protection against inflation not only through its dividend but also through its business. It’s simply a very robust, recession-proof business that is able to beat inflation over a long period.
TradingView
Buying AAPL with stops under the low. A new bull market may start soon, if not the risk with this stop is reasonable. Would probably turn bear under it.
May 17
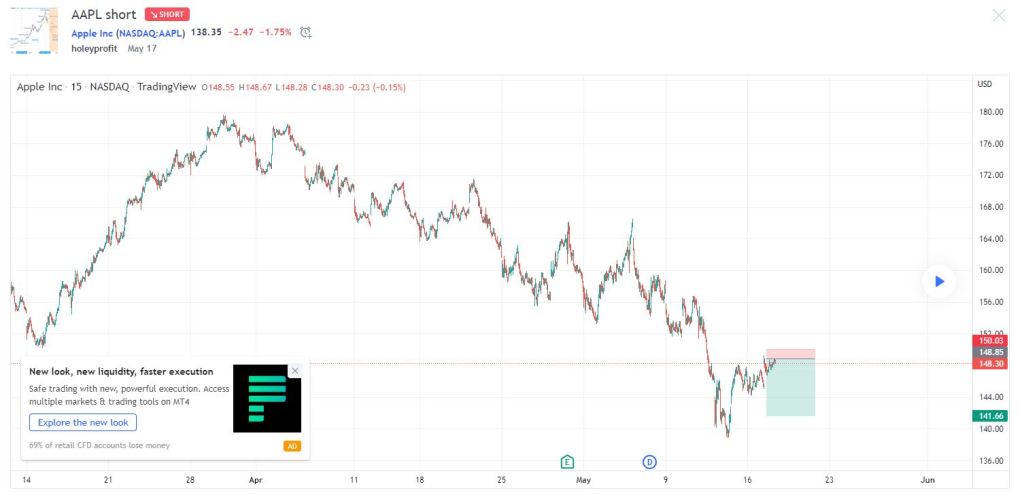
Shorting AAPL , expecting this to at least retrace to test the lows. I think we’re possibly near a big low in AAPL but if we are that tends to mean the final few short trades are the easiest ones.
May 18
Comment: Exited at profit 143
Ideas:

As you can see by the chart, I have labeled every time $AAPL has deviated from its current trend and what follows right after.
This has been a consistent pattern over the last decade and I believe today is no different.
Powell reaffirmed his fight for Price Stability yesterday and will continue to do so until the mission is accomplished.
50 Year High Inflation , War, FED hiking into a slowing economy, QT, Supply Chain shocks, Sanctions/Embargoes, Energy soaring, Gas at $4 in every state in America for the first time in history.
This is not Price Stability.

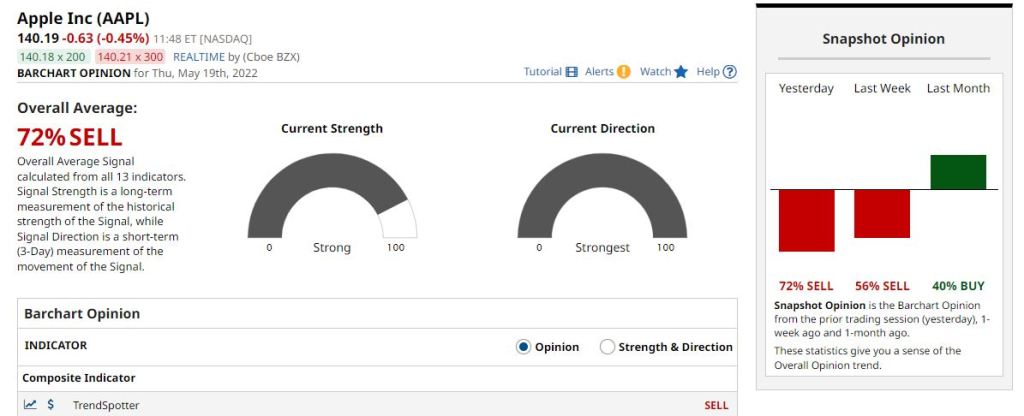
Barchart


Previous Close 140.82
Volume 54,279,701
Avg Vol 110,083,953
Stochastic %K 15.73%
Weighted Alpha -2.20
5-Day Change -4.06 (-2.85%)
52-Week Range 123.13 – 182.94
Fundamentals
- Market Capitalization, $K2,415,476,480
- Shares Outstanding, K16,185,181
- Annual Sales, $365,817 M
- Annual Income, $94,680 M
- 60-Month Beta 1.19
- Price/Sales 6.44
- Price/Cash Flow 23.11
- Price/Book 35.84


Leave a comment