Contents:
- Motley Fool Stock Advisor’s Latest Update
- Can We Predict Stock Inflation Resistance?
- AAPL Inflation Resistance Example

Certain kinds of stocks can help you fight it effectively.
Motley Fool Stock Advisor’s Latest Update
Inflation has gotten worse in recent years: in June 2021, the CPI exceeded +5%. Initially thought to be transitory, inflation continued to rise, reaching +8.3% CPI in April of this year.
Inflation isn’t a theoretical risk. Inflation has averaged around 3% annually over many years, and over 25 years, that’s enough to cut the purchasing power of your retirement dollars in half.
Keep inflation in mind as you invest. Certain kinds of stocks can help you fight it effectively. Here are three examples:
- dividend-paying stocks can be great inflation fighters because their payouts generally increase over time, often exceeding the inflation rate.
- Companies with pricing power can raise their prices to keep up with inflation.
- Banking stocks are also poised to fare well in inflationary environments.
Consider Waste Management (WM -2.65%), the trash collection and recycling giant. Apple (AAPL -5.64%), maker of devices that may be in your pocket, on your wrist, or on your desk right now, is another dividend payer. Some Apple revenue generators, such as the App Store and services such as Apple Pay and Apple TV+, don’t even have conventional raw materials to worry about. Financial Select Sector SPDR ETF: there are more than a few solid bank stocks you can consider for your portfolio, but you would do well to also consider bank-focused exchange-traded funds (ETFs), which are funds that trade like stocks, often with low annual fees. The Financial Select Sector SPDR ETF (XLF -2.75%) is a fine example, charging an expense ratio (annual fee) of just 0.12% and averaging returns of close to 14% annually over the past decade. That excludes dividends, and the ETF recently yielded 1.25%.
Can We Predict Stock Inflation Resistance?
Let’s predict the Stock Inflation Resistance (SIR) using the Python Data Exploration Analysis. The actual ETL pipeline consists of the following key steps:
- Download 3 historical datasets – stock price and monthly/annual CPI
- Compute the monthly/annual stock performance (%) and CPI rate (%)
- Apply linear regression to the stock vs CPI performance cross-plot
- Check the slope or gradient of the linear trend – positive, negative or zero.
AAPL Inflation Resistance Example
Let’s import/install key libraries
import os
import re
import datetime as dt
from concurrent import futures
import pandas as pd
import numpy as np
import matplotlib.pyplot as plt
import pandas_datareader.data as web
from sklearn.linear_model import LinearRegression
data_dir = “YourPath”
os.makedirs(data_dir, exist_ok=True)
!pip install yfinance
import pandas
from pandas_datareader import data as pdr
import yfinance as yf
import matplotlib.pyplot as plt
%matplotlib inline
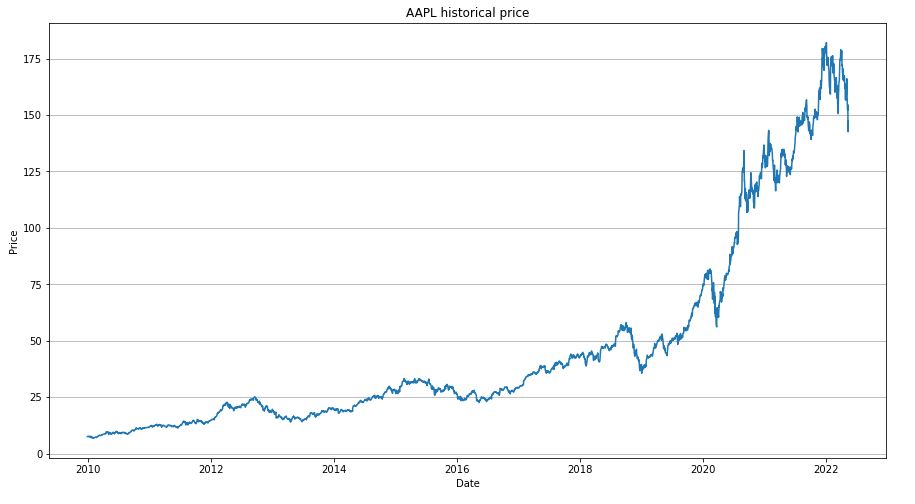
Get the data for the stock AAPL
data = yf.download(‘AAPL’,’2010-01-01′,’2022-05-16′)
Plot the close price of the AAPL
sp_500=data
fig, ax = plt.subplots(figsize=(15, 8))
ax.plot(sp_500.index, sp_500[“Close”])
ax.grid(axis=”y”)
ax.set_title(“AAPL historical price”)
ax.set_xlabel(“Date”)
ax.set_ylabel(“Price”)
plt.show()
import pandas_datareader as web
import pandas as pd
from matplotlib import pyplot as plt
import seaborn as sns
start = dt.datetime(2010,1,1)
end = dt.datetime(2022,5,16)
SP500 = web.DataReader(‘SP500′,’fred’,start,end)
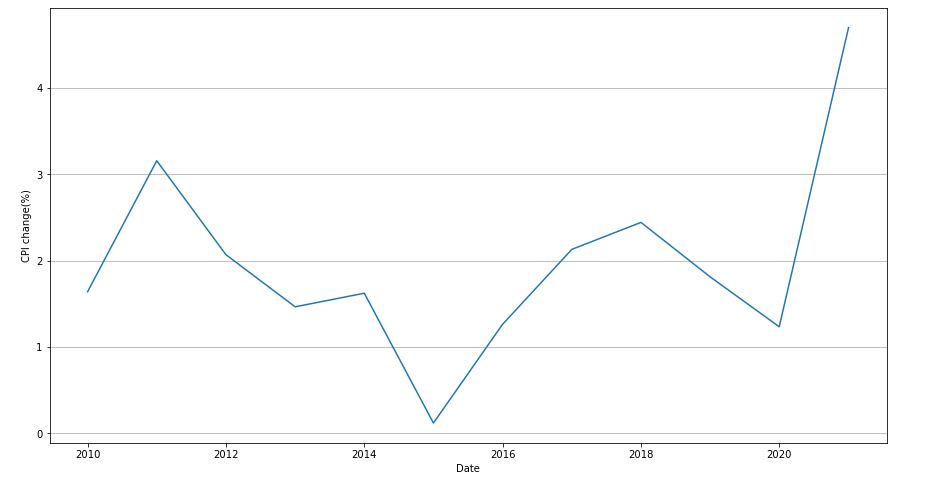
cpi_annual = web.DataReader(‘FPCPITOTLZGUSA’, ‘fred’, start, end)
fig, ax = plt.subplots(figsize=(15, 8))
plt.plot(cpi_annual)
plt.grid(axis=”y”)
plt.xlabel(“Date”)
plt.ylabel(“CPI change(%)”)
plt.show()
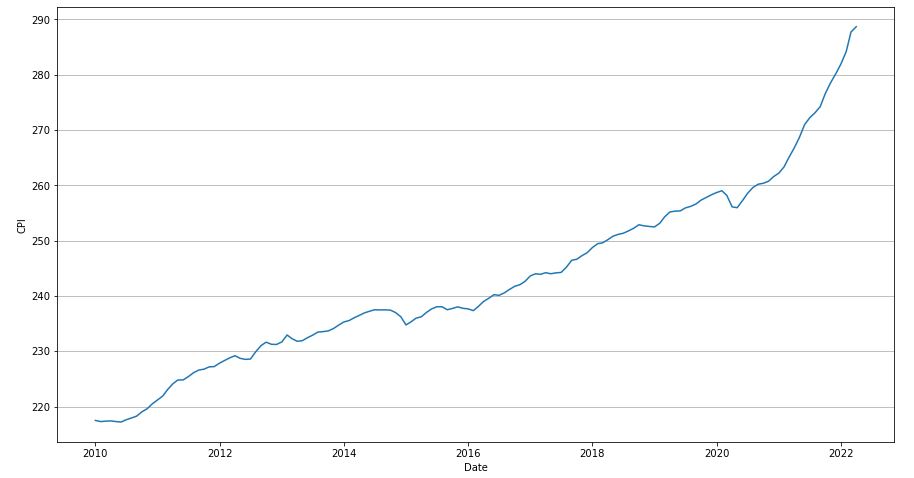
cpi_monthly = web.DataReader(‘CPIAUCSL’, ‘fred’, start, end)
fig, ax = plt.subplots(figsize=(15, 8))
plt.plot(cpi_monthly)
plt.grid(axis=”y”)
plt.xlabel(“Date”)
plt.ylabel(“CPI”)
plt.show()
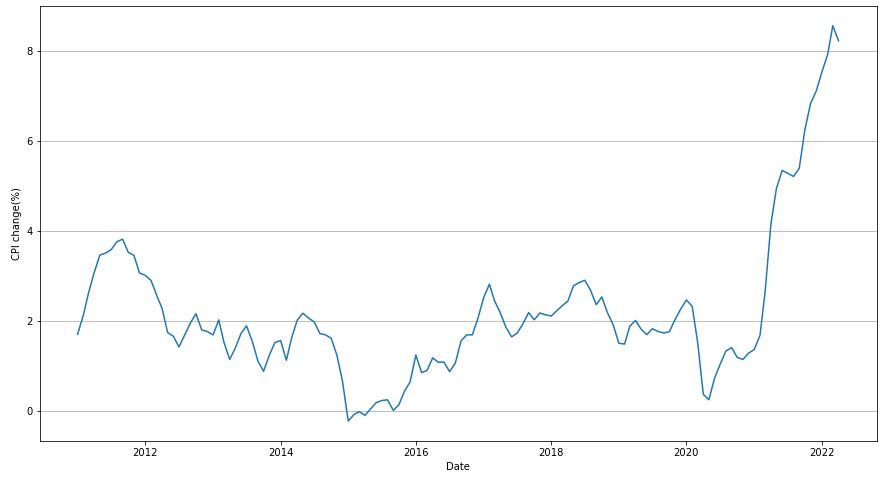
fig, ax = plt.subplots(figsize=(15, 8))
cpi_monthly_change = cpi_monthly / cpi_monthly.shift(12) * 100 – 100
plt.plot(cpi_monthly_change)
plt.grid(axis=”y”)
plt.xlabel(“Date”)
plt.ylabel(“CPI change(%)”)
plt.show()
Let’s compute the stock performance index
annual_data_list = []
year_list = sp_500.index.year.unique()
for year in year_list:
last_day_data = sp_500[sp_500.index.year == year].tail(1)
annual_data_list.append(last_day_data)
sp500_annual = pd.concat(annual_data_list)
sp500_annual_performance = sp500_annual[[“Close”]] / sp500_annual[[“Close”]].shift(1) * 100 – 100
sp500_annual_performance.index = pd.to_datetime(sp500_annual_performance.index.strftime(“%Y”))
sp500_annual_performance.tail()

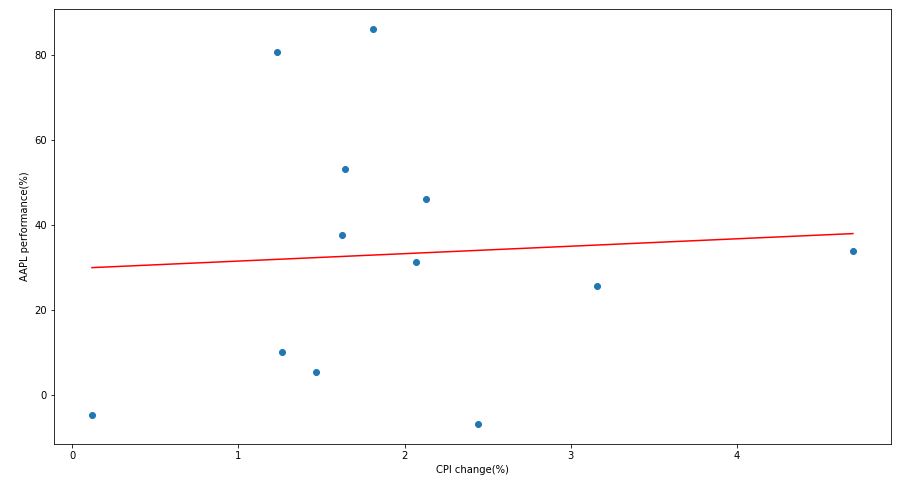
Let’s merge the data and apply linear regression
merge_df = pd.merge(cpi_annual, sp500_annual_performance, left_index=True, right_index=True)
merge_df.rename(columns={“FPCPITOTLZGUSA”: “CPI”, “Close”: “SP500”}, inplace=True)
fig, ax = plt.subplots(figsize=(15, 8))
model = LinearRegression()
model_reg = model.fit(merge_df[[“CPI”]], merge_df[“SP500”])
reg_curve_x = np.linspace(min(merge_df[“CPI”]), max(merge_df[“CPI”]))
reg_curve_y = model_reg.predict(reg_curve_x.reshape(-1, 1))
plt.scatter(merge_df[“CPI”], merge_df[“SP500”])
plt.plot(reg_curve_x, reg_curve_y, color=”red”)
plt.xlabel(“CPI change(%)”)
plt.ylabel(“AAPL performance(%)”)
plt.show()
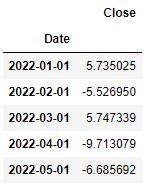
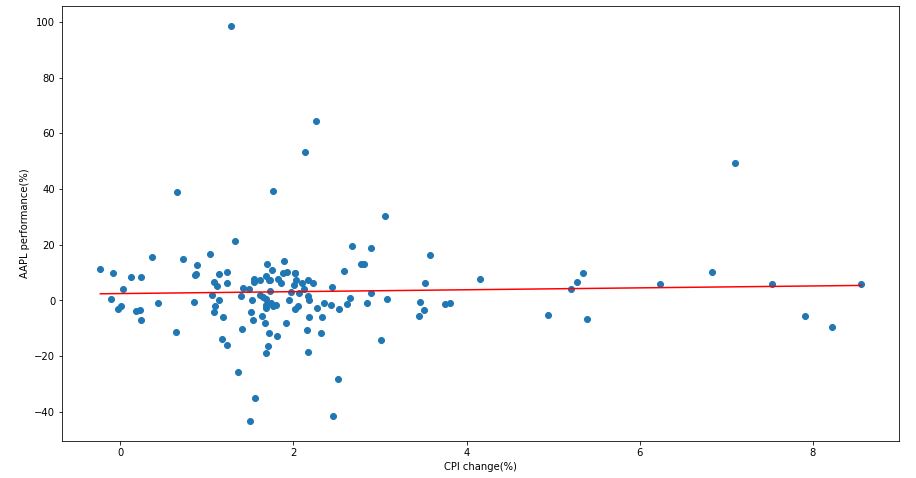
Let’s compute the monthly AAPL-CPI performance trend
monthly_data_list = []
month_list = sp_500.index.month.unique()
for year in year_list:
for month in month_list:
last_day_data = sp_500[(sp_500.index.year == year) & (sp_500.index.month == month)].tail(1)
monthly_data_list.append(last_day_data)
sp500_monthly = pd.concat(monthly_data_list)
sp500_monthly_performance = sp500_monthly[[“Close”]] / sp500_monthly[[“Close”]].shift(1) * 100 – 100
sp500_monthly_performance.index = pd.to_datetime(
sp500_monthly_performance.index.strftime(“%Y-%m”)) # reset index to YYYY-01-01
sp500_monthly_performance.tail()
fig, ax = plt.subplots(figsize=(15, 8))
merge_df_monthly = pd.merge(
cpi_monthly_change,
sp500_monthly_performance,
left_index=True,
right_index=True)
merge_df_monthly.rename(columns={“CPIAUCSL”: “CPI”, “Close”: “SP500”}, inplace=True)
merge_df_monthly.dropna(inplace=True)
model_monthly = LinearRegression()
model_monthly_reg = model_monthly.fit(merge_df_monthly[[“CPI”]], merge_df_monthly[“SP500”])
reg_curve_monthly_x = np.linspace(min(merge_df_monthly[“CPI”]), max(merge_df_monthly[“CPI”]))
reg_curve_monthly_y = model_monthly_reg.predict(reg_curve_monthly_x.reshape(-1, 1))
plt.scatter(merge_df_monthly[“CPI”], merge_df_monthly[“SP500”])
plt.plot(reg_curve_monthly_x, reg_curve_monthly_y, color=”red”)
plt.xlabel(“CPI change(%)”)
plt.ylabel(“AAPL performance(%)”)
plt.show()
Conclusion
Both annual and monthly linear regression trends of the AAPl stock performance vs CPI change show a clear positive gradient. This means that this dividend stock is a good candidate for your inflation-resistant portfolio for reasons beyond its dividend. In fact, AAPL offers some protection against inflation not only through its dividend but also through its business. It’s simply a very robust, recession-proof business that is able to beat inflation over a long period.
Check the github link


Leave a comment