Tag: stockstobuy
-
Real-Time Stock Sentiment Analysis w/ NLP Web Scraping

Stock sentiment analysis is gaining popularity as a technique to understand public opinions on specific assets. This study uses NLP web scraping in Python to extract stock sentiments from financial news headlines on FinViz. The sentiment analysis can help determine investor opinions and potential impacts on stock prices, though it is not a standalone predictor.
-
Dividend-NG-BTC Diversify Big Tech

SEO Title: Can Dividends, Natural Gas and Crypto Diversify Big Techs? Ultimately, we need to answer the following fundamental question: Can Dividend Kings, NGUSD and BTC-USD Diversify Growth Tech assets? Dividends are very popular among investors, especially those who want a steady stream of income from their investments. Some companies choose to share their profits…
-
Multiple-Criteria Technical Analysis of Blue Chips in Python

Blue chip stocks are the stocks of well-known, high-quality companies. We demonstrate that the proposed approach can help optimize the blue-chip portfolios comprehensively.
-
Data Visualization in Python – 1. Stock Technical Indicators

Featured Photo by Monstera on Pexels. In this project, we will implement the following Technical Indicators in Python: Conventionally, we will look at the following three main groups of technical indicators: Input Stock Data Let’s set the working directory VIZ import osos.chdir(‘VIZ’)os. getcwd() and import the key libraries import datetime as dtimport pandas as pdimport…
-
Gold Price Linear Regression

This content focuses on predicting gold prices using machine learning algorithms in Python. With an 80% R2-score and a Sharpe ratio of 2.33, it suggests a potential 8% revenue from an investment starting in December 2022. The forecasted next-day price for SPDR Gold Trust Shares is $185.136, aligning with Barchart’s “100% BUY” signal.
-
JPM Breakouts: Auto ARIMA, FFT, LSTM & Stock Indicators

The post discusses predicting JPM stock prices for 2022-2023 using several predictive models like ARIMA, FFT, LSTM, and Technical Trading Indicators (TTIs) such as EMA, RSI, OBV, and MCAD. The ARIMA model used historical data, while the partial spectral decompositions of stock prices served as features for the FFT model. TTIs were calculated to validate…
-
Towards Max(ROI/Risk) Trading

This post compares 1-year ROI/Risk of selected stocks vs ETF using stock analyzer functions. It includes comparing prices, visualizing annual risk and return, and examining correlation matrix of stock returns. It provides insights for selecting CPB stock for trading based on low correlation with ^GSPC, high return (~20%), and low risk (~23%).
-
Comparison of Global Growth Stocks – 2. AZN

Summary: A comprehensive QC assessment of top growth stocks in Q1’23 was conducted, focusing on A-rated AstraZeneca PLC (AZN) in the biopharmaceutical industry. The company’s financial indicators, technical analysis, and algorithmic trading signals were analyzed. Backtesting showed a 34% profit from investing in AZN, outperforming the benchmark by 50%.
-
Comparison of U.S. Growth Stocks – 1. WMT

The U.S. labor market and consumer spending are robust despite economic challenges. Bank of America reports a 5.1% rise in credit and debit card spending in January. The focus is on A-rated growth stocks like Walmart Inc. (WMT), with promising metrics and technical indicators supporting a Strong Buy sentiment. Algo trading with DI shows successful…
-
Stocks to Watch in 2023: MarketBeat Ideas

Let’s review the 10 best stocks to own in 2023 (brought to you by Marketbeat.com). Featured Photo by Alesia Kozik on Pexels. Uncertainty is the Only Certainty for 2023: It’s Hard to Own Stocks When the Market is Falling: Focus on Opportunity, Value and Dividends in 2023: On a sector basis, the energy sector looks…
-
Energy E&P: XOM Technical Analysis Nov ’22

Featured Photo by Kayden The last few years offer a case study of how quickly energy markets can shift. According to our recent post, Oil & Gas Exploration and Production (E&P) stays the top energy sector, remaining firmly at Very Attractive to Buy. In the light of what we know about E&P business, let’s take…
-
The Zacks Market Outlook Nov ’22 – Energy

Featured Image by Canva. Let’s review the current Energy Market Outlook to power your investment portfolio with Zack Research. Indeed, Energy is at the heart of development. Energy makes possible the investments, innovations, and new industries that are the engines of jobs, inclusive growth, and shared prosperity for entire economies. What Rapidly Shifting Energy Markets…
-
The $ASML Trading Strategies via the Plotly Stock Market Dashboard

Dr. Dividend has shared an insight into a stock market analysis using Plotly’s interactive Stock Market Dashboard. The rundown explains how to fetch live data using yfinance API, create visuals incorporating moving averages, and craft multiple trading signals, including the use of the MACD and Stochastic Oscillator. The tutorial also guides on saving the final…
-
Zacks Investment Research Update Q4’22
Featured Photo by Yiorgos Ntrahas on Unsplash Let’s continue exploring the most popular articles, ideas and opinions from Zacks.com. Contents: Update for Monday, October 24 2022 S&P 500: 3,752.75 +86.97 (+2.37%) Dow: 31,082.56 +748.97 (+2.47%) Nasdaq: 10,859.72 +244.87 (+2.31%) Stocks Soared On Friday And For The Week: Investor Fears Create Opportunity Bottom line – right now, stocks are way underpriced, the markets are way oversold, and you…
-
Portfolio Optimization Risk/Return QC – Positions of Humble Div vs Dividend Glenn
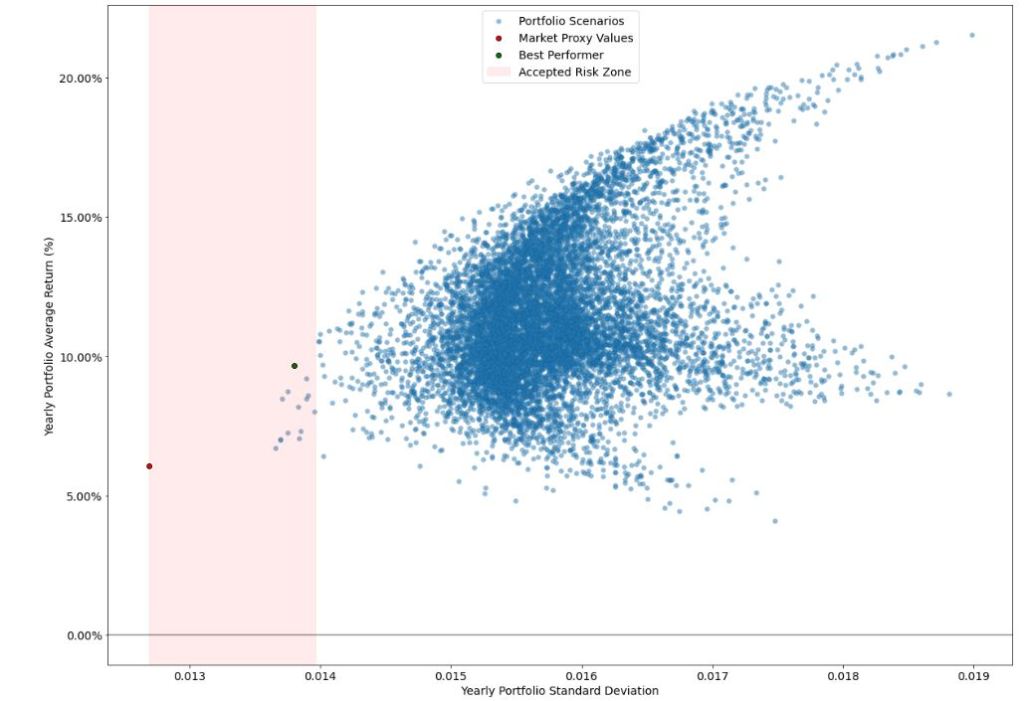
The Portfolio Optimization Algorithm (POA) is used for comparing the top five stock positions of Humble Div (HD) and Dividend Glenn (DG) from 2017 to 2022. The Risk/Return Ratio (RRR) shows HD portfolio as a better performer than DG portfolio and the market. Both portfolios and market are within risk boundaries.
-
All Eyes on ETFs Sep ’22

ETF Focus September 2022: Is Now A Good Time To Buy ETFs? Cons and Pros of ETFs Sectors On Watch The Pup’s Weekend Dig Zacks.com SeekingAlpha TradingView Barchart AIolux Macroaxis S&P 500 Related Infographic Commodity trends, cryptocurrency, AI optimization, and more.
-
SeekingAlpha Risk/Reward July Rundown

Lets see what SA is up to in terms of Risk/Reward as of 2022-07-25: Cryptocurrency Digest: SA Morning Briefing: SPY: Overbought Demand Testing Resistance (Technical Analysis) Wall Street Breakfast: In arguably the most important week for Wall Street this summer, with the Fed decision and GDP on tap, earnings could actually end up determining direction. There are 175…
-
Algorithmic Testing Stock Portfolios to Optimize the Risk/Reward Ratio
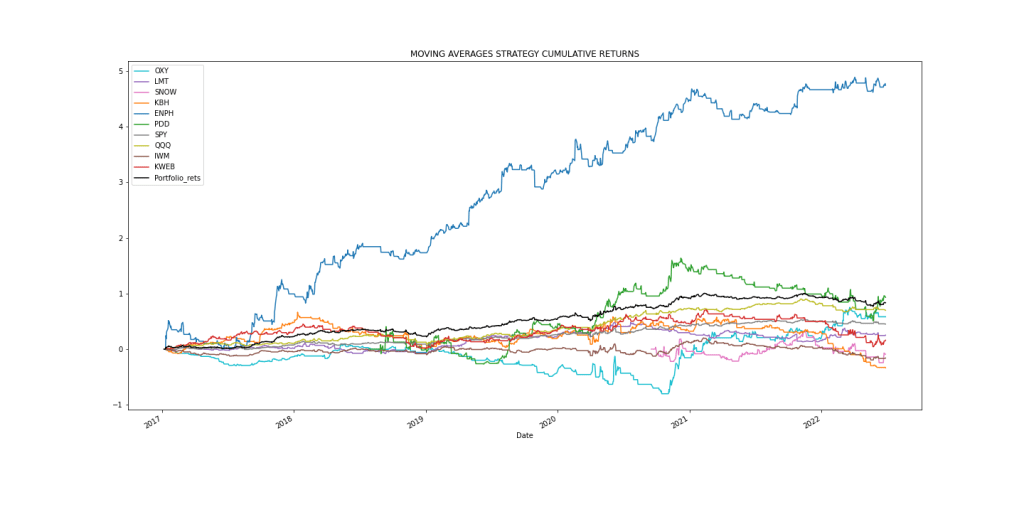
Investors can optimize their stock portfolio by invoking backtesting within the realm of algorithmic trading. The goal is to optimize the specific portfolio by maximizing returns and the Sharpe ratio.
-
OXY Stock Update Wednesday, 25 May 2022
OXY Stock Update Friday, 20 May 2022 Energy Stocks Rebound Friday With 4% Jump in Crude Oil Prices Occidental Petroleum Shares Rise After Berkshire Hathaway Adds Stake in Firm TechView Opinion – BUY
-
Inflation-Resistant Stocks to Buy
Inflation-Resistant Stocks to Buy AAPL Example Python workflow Download 3 historical datasets – stock price and monthly/annual CPI Compute the monthly/annual stock performance (%) and CPI rate (%) Apply linear regression to the stock vs CPI performance cross-plot Check the slope or gradient of the linear trend – positive, negative or zero.
