Based upon the Portfolio Optimization Algorithm (POA) discussed earlier and the relevant POA QC use-case (positions of The Dividend Breeder), let’s run the similar algorithm to compare top 5 stock positions of Humble Div (HD) vs Dividend Glenn (DG) in terms of the Risk/Return Ratio (RRR) or RRR1=1/RRR.
Let’s define the following common POA parameters:
benchmark_ = [“^GSPC”,]
start_date_ = “2017-01-01”
end_date_ = “2022-10-01”
number_of_scenarios = 10000
delta_risk = 0.1
Let’s compare the following two portfolios:
HD
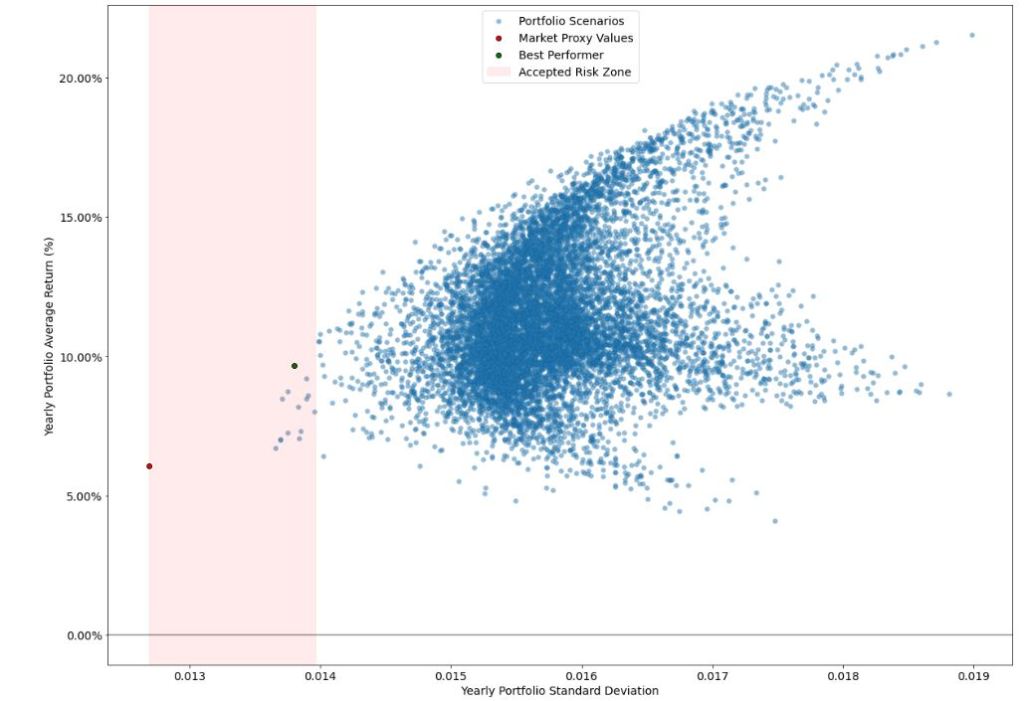
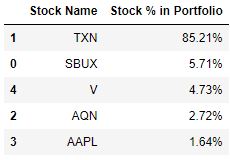
portfolio_ = [‘SBUX’, ‘TXN’, ‘AQN’, ‘AAPL’, ‘V’]
DG
portfolio_ = [‘INTC’, ‘MMM’, ‘T’, ‘O’, ‘MO’].
The POA output is as follows:

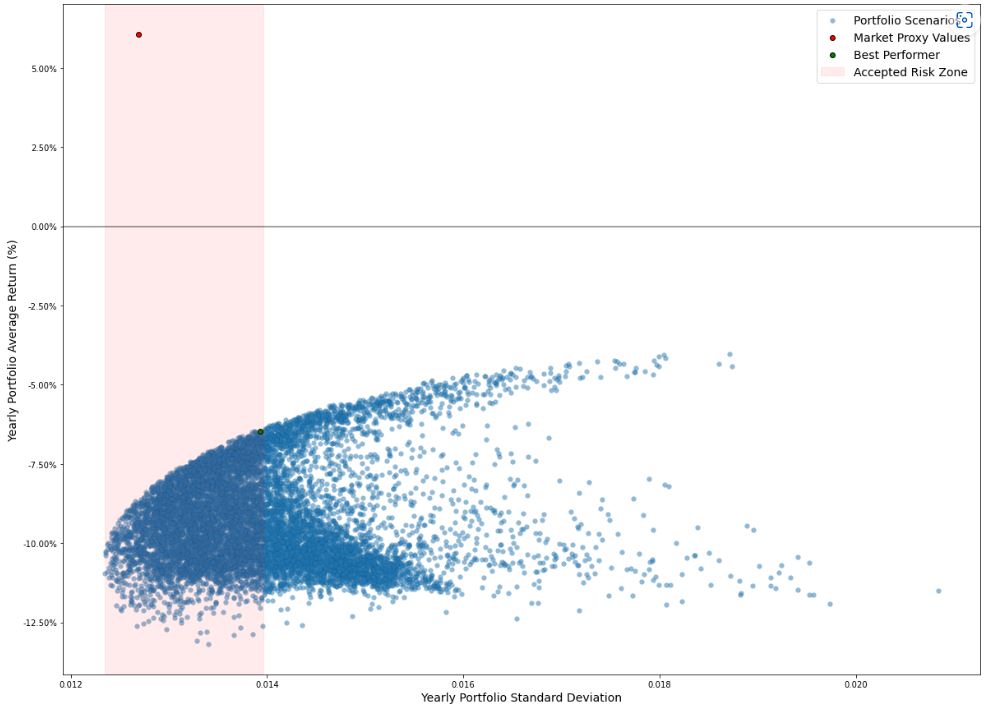

The Table below is the summary of our observations:
| start_date_ = “2017-01-01” end_date_ = “2022-09-30” | HD | DG | Market |
| Risk | ~0.0138 | ~0.014 | ~0.0127 |
| Return | ~10% | ~-6.5% | ~6% |
| Return/Risk (RRR1=1/RRR) | ~7.2 | ~-4.6 | ~4.7 |
Even though both portfolios and market are within our risk boundaries, we can see that RRR1(HD) > RRR1(Market) >> RRR1(DG). We conclude that HD portfolio is the best performer in this QC test.


Make a one-time donation
Make a monthly donation
Make a yearly donation
Choose an amount
Or enter a custom amount
Your contribution is appreciated.
Your contribution is appreciated.
Your contribution is appreciated.

Leave a comment