
The last few years offer a case study of how quickly energy markets can shift.
According to our recent post, Oil & Gas Exploration and Production (E&P) stays the top energy sector, remaining firmly at Very Attractive to Buy.
In the light of what we know about E&P business, let’s take a helicopter view + BI analysis of ExxonMobil Corp (NYSE: XOM) in terms of latest news/headlines, technicals, fundamentals, stock comparisons, financials and beyond.
Contents:
- Zacks
- MarketWatch
- CNBC
- SeekingAlpha
- TradingView
- BarChart
- MacroAxis
- Key Takeaways
- Explore More
- Infographics
- TradingView Stock Heatmaps
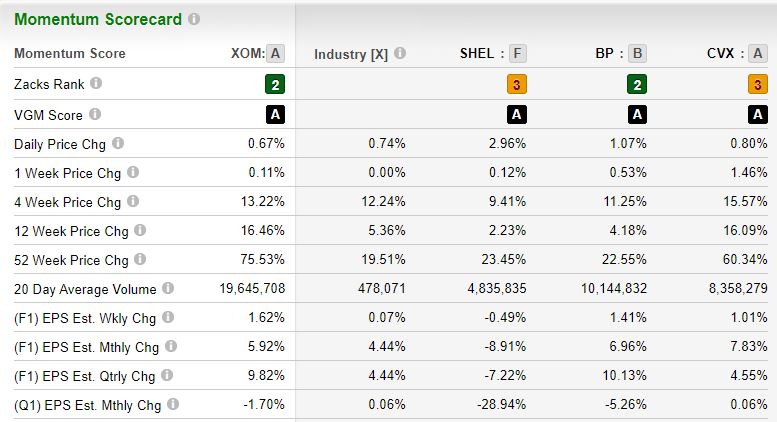
Zacks
- XOM’s bellwether status in the energy space, optimal integrated capital structure that has historically produced industry-leading returns and management’s track record of capex discipline across the commodity price cycle make it a relatively lower-risk energy sector play.
- The company’s upstream portfolio has not generated much production growth in 2019 and the trend isn’t expected to change at least in the near term. It nevertheless owns some of the most prolific upstream assets globally. Other aspects of the company’s story include the largest global refining operations, substantial chemicals assets and a dividend history and credit profile that are second to none in the space.
- As compared to other energy giants, XOM’s capital spending discipline is quite aggressive. The company has a plan in place to allocate significant proportion of its budget to key oil and gas projects that include offshore Guyana resources and Permian – the most prolific shale play in the United States.
- Needless to say, the company’s business perspective looks different from most peers since big oil rivals have pledged to lower carbon emissions to tackle climate change.
- To improve the efficiency of operations, the company formed XOM Product Solutions combining the Downstream and Chemical businesses. It also centralized Technology & Engineering and Operations & Sustainability groups to capture the benefits of technology, scale and integration. The compan changed its segment reporting to reflect the new structure.
- XOM divides its operations into three main segments: Upstream (exploration & production), Downstream (refining) and Chemical (manufacturing & marketing petrochemicals). In 2021, Upstream and Downstream units generated a profit of $15.8 billion and $2.1 billion, respectively. The Chemical segment generated a profit of $7.8 billion in 2021.


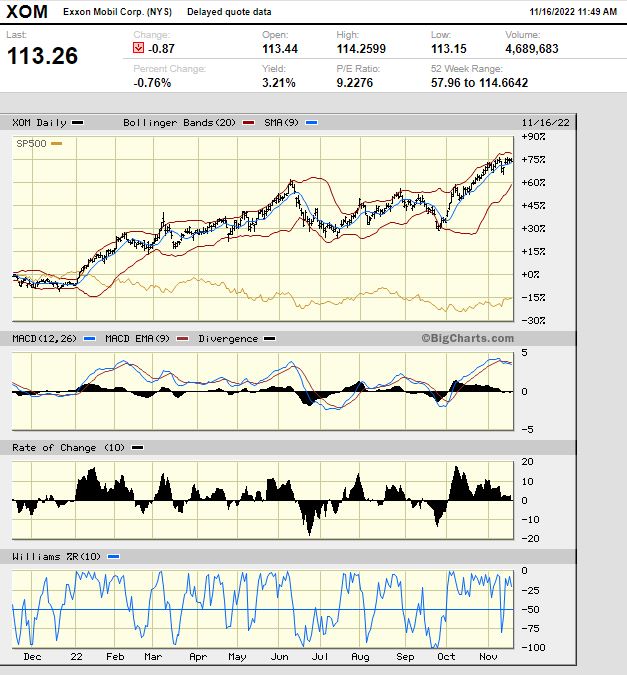
MarketWatch
Exxon Mobil Corp. stock rises Tuesday, still underperforms market
(Published: Nov. 15, 2022 at 5:33 p.m. ET)
Let’s look at BigCharts:


CNBC
Profile:
- Exxon Mobil Corporation is engaged in energy business. The Company’s principal business involves exploration for, and production of, crude oil and natural gas, and the manufacture, trade, transport and sale of crude oil, natural gas, petroleum products, petrochemicals and a range of specialty products.
- The Company’s segments include Upstream, Downstream and Chemical.
- The Upstream segment is organized and operates to explore for and produce crude oil and natural gas.
- The Downstream segment manufactures, trades and sells petroleum products. The refining and supply operations encompass a global network of manufacturing plants, transportation systems, and distribution centers that provide a range of fuels, lubricants and other products and feedstocks to its customers around the world.
- The Chemical segment is organized and operates to manufacture and sell petrochemicals. The Chemical business supplies olefins, polyolefins, aromatics, and a variety of other petrochemicals.
Market News: XOM Stock Could Take a $2B Hit on the Sale of California Asset.

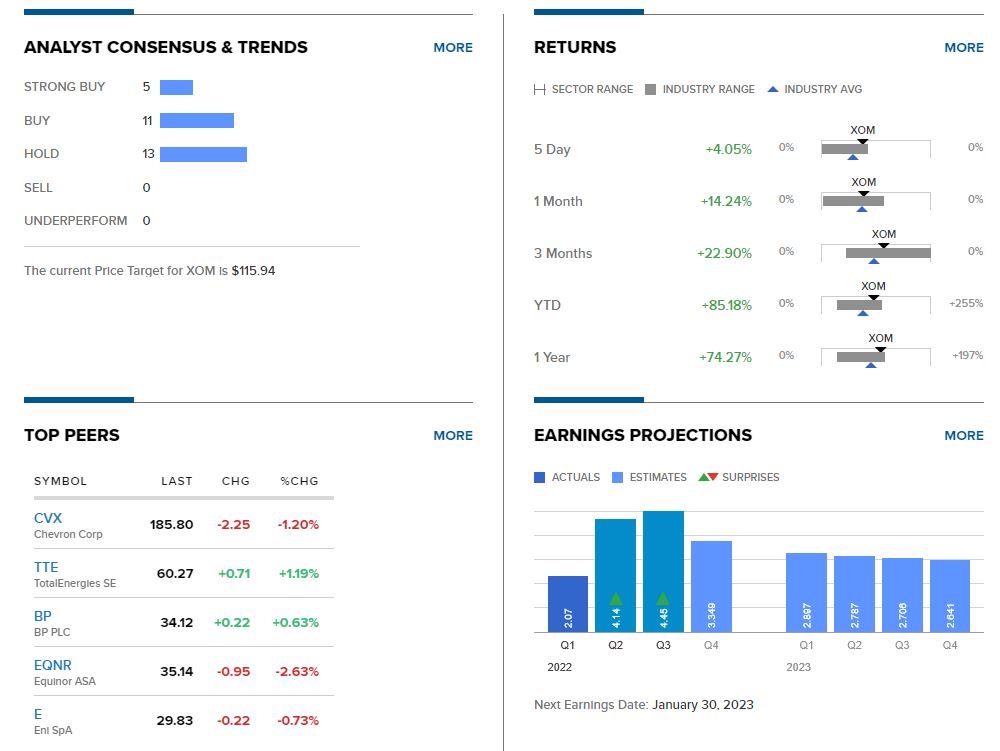
SeekingAlpha
$112.47-1.66 (-1.45%)1:56 PM 11/16/22
Wall Street Breakfast: Nov. 16, 2022 7:10 AM ET
- Trump is launching a campaign that boosts coal and energy stocks including Exxon Mobil (XOM).
Long Ideas Exxon Mobil: Breakout Time Nov. 01, 2022 12:56 PM ET
- More Guyana discoveries reported.
- Clearly taking on more debt in fiscal year 2020 turned out to be the right move because those projects now take advantage of very strong commodity prices.
- The Guyana partnership is expected to produce 1 million BOD by the end of the decade.
- The cost advantage to major projects of working through the industry downturn is considerable, despite the additional debt.
- This company reported production growth at a time when few companies in the industry are growing.

- Exxon Mobil is holding up well in this environment.
- The recent inflation data didn’t push XOM around much; up or down.
- Despite various macro demand shifts, XOM continues to win and will likely continue winning because of how they are handling supply.
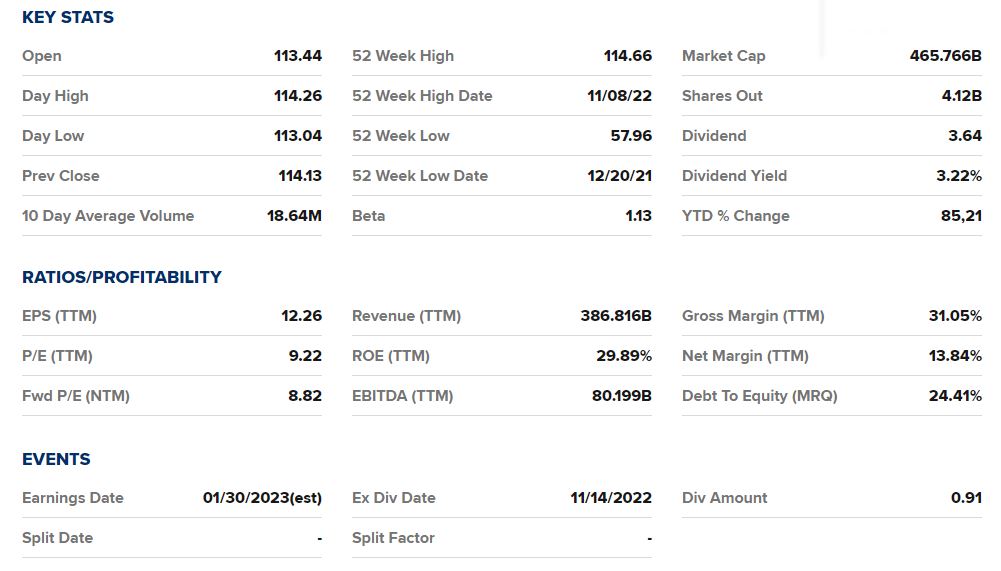
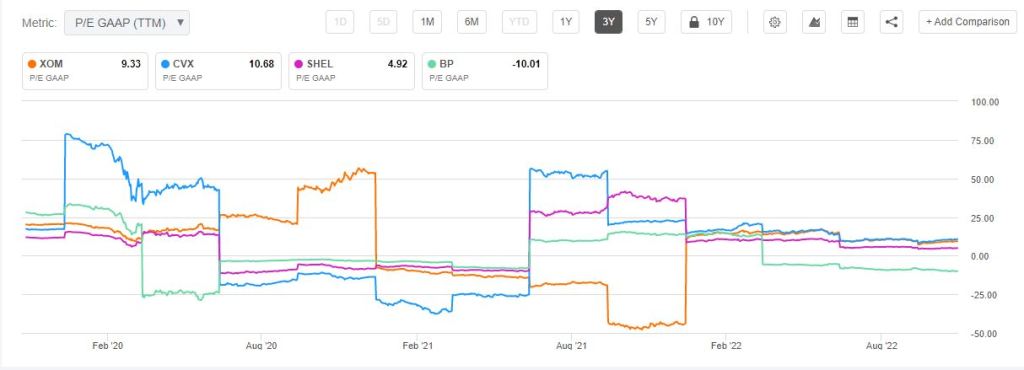
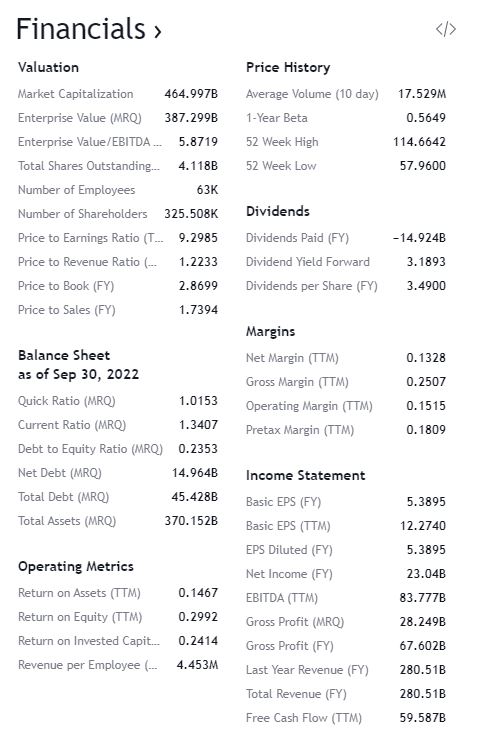
XOM Ratings: Profitability A+, Growth C-, Valuation C.

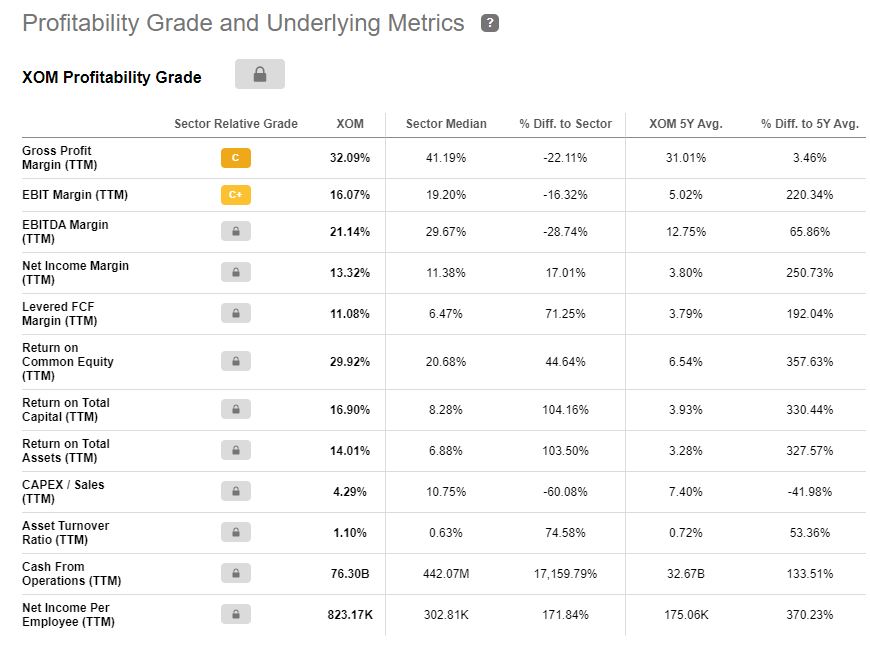


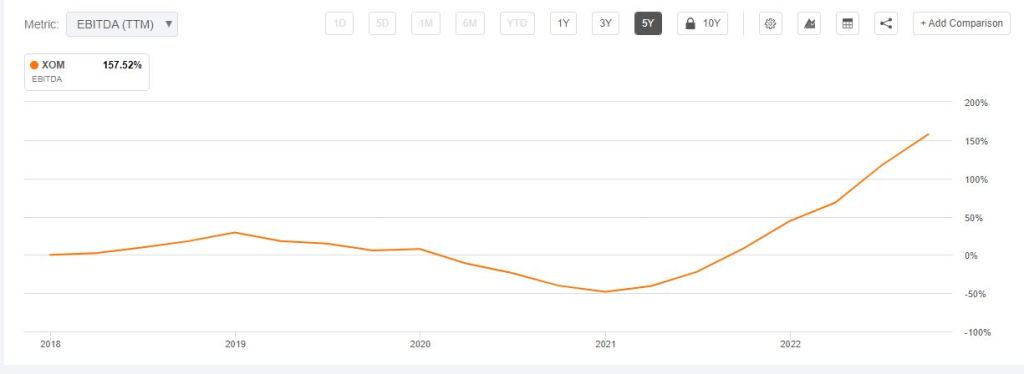
EBITDA, or earnings before interest, taxes, depreciation, and amortization, is an alternate measure of profitability to net income.

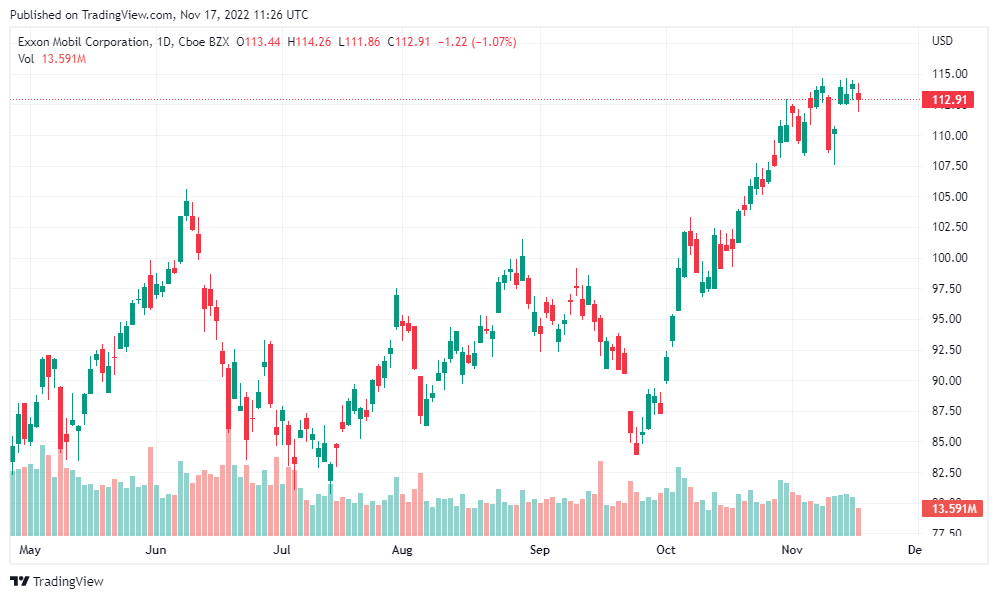
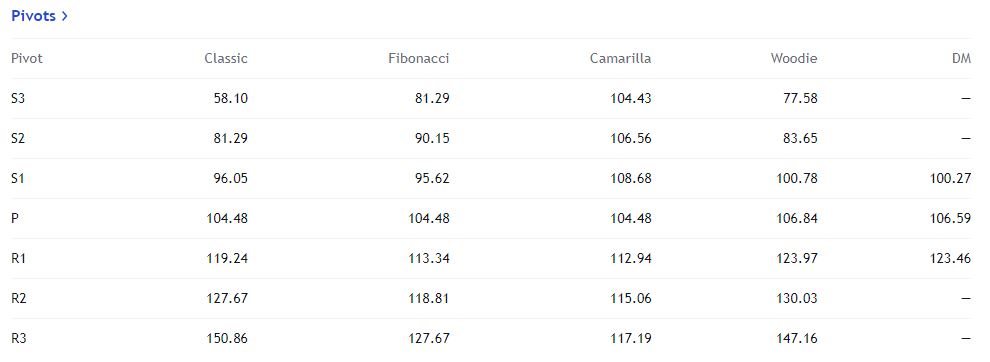
TradingView
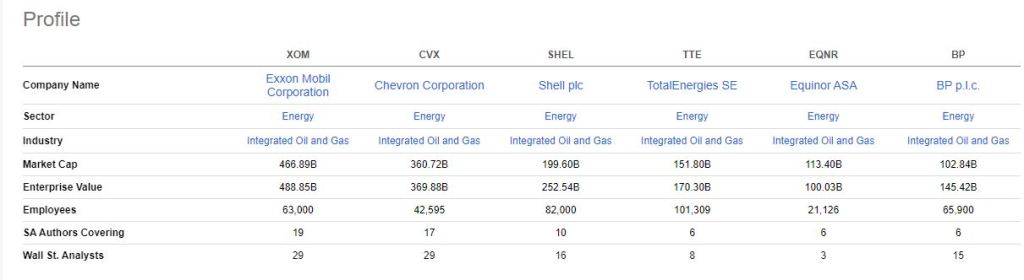
XOM Profile:
Sector: Energy Minerals
Industry: Integrated Oil
Exxon Mobil Corp engages in the exploration, development, and distribution of oil, gas, and petroleum products. It operates through the following segments: Upstream, Downstream and Chemical. The Upstream segment produces crude oil and natural gas. The Downstream segment manufactures and trades petroleum products. The Chemical segment offers petrochemicals. The company was founded by John D. Rockefeller in 1882 and is headquartered in Irving, TX.
XOM trend analysis:


Simple chart here that makes a likely case for a downward directional trade. There are 4 simple moving averages – 10, 20, 50, 200. Yellow arrow mark major tops which also line up with RSI over 70 (orange circles) and directional movement (DMI) peaks.
Directional movement is a less popular volume indicator, but it has saved me many times on a 5m chart from entering a trade at the wrong time. The green line (DI+) indicates buying and red line (DI-) indicates selling. The gray line shows total directional movement for a 7-period setting. This is the important one, as it indicates when movement in one direction (in this case buying) has become extreme so buyers will be exhausted and then selling ensues.
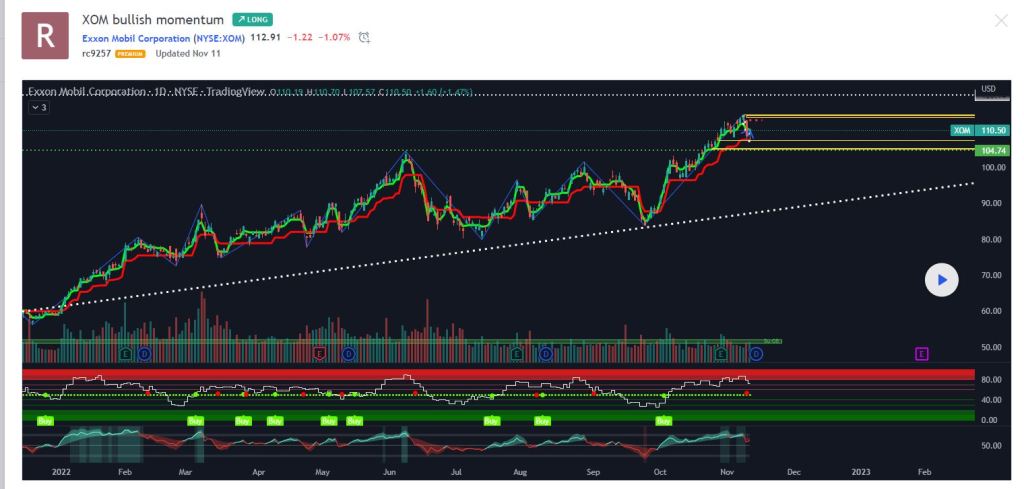
Trendsi indicators showing bullish momentum with Middle band Green meaning bullish . Though the Money momentum white line currently coming out the upper red bands, Oil has been the talk. With prices going up. Time will tell the outcome with prices surging for oil . Supply and Demand for oil will either push the oil market higher or crash it.

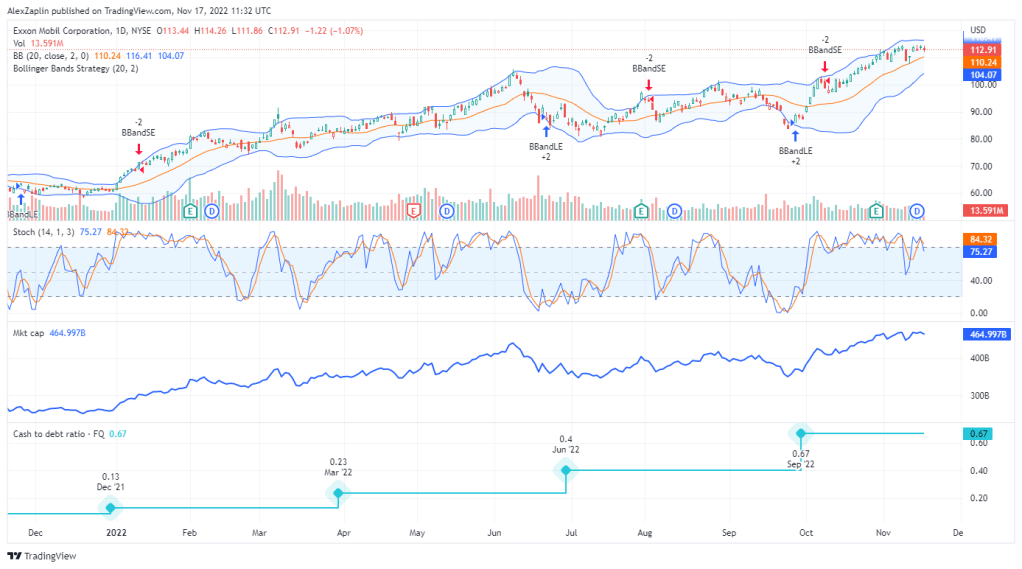


Top chart shows XOM approaching to a major resistance, bottom chart shows oil futures . Oil still trading over the uptrend resistance but is loosing steam. It might break down in a few weeks from now and XOM will follow. Keep it it in your watchlist to short it. I have a small short position waiting for a nice rejection to add. I wouldn’t open new longs in energy stocks at this time.
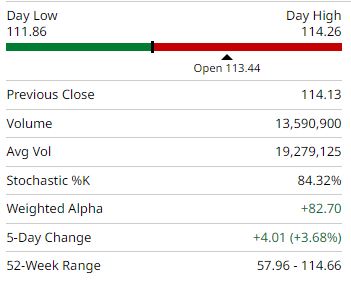
BarChart
QUOTE OVERVIEW for Wed, Nov 16th, 2022
Fundamentals:
- Market Capitalization, $K464,996,480
- Shares Outstanding, K4,118,293
- Annual Sales, $285,640 M
- Annual Income, $23,040 M
- 60-Month Beta1.14
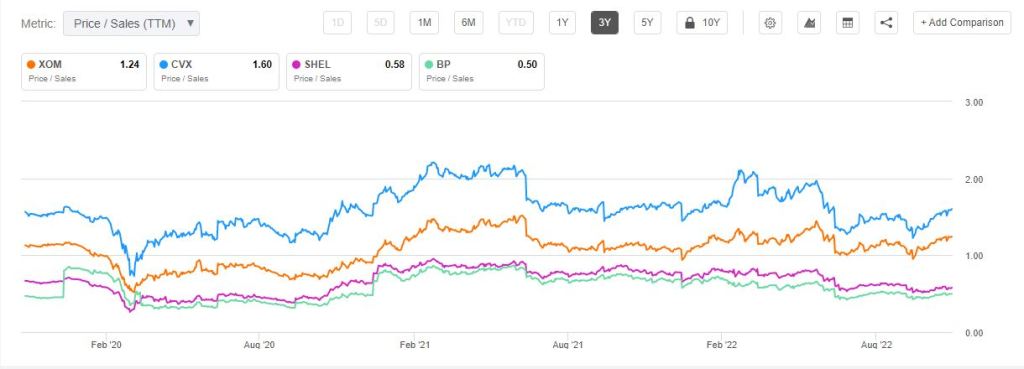
- Price/Sales1.65
- Price/Cash Flow11.08
- Price/Book2.43
- Price/Earnings ttm8.98
- Earnings Per Share ttm12.71
- Most Recent Earnings4.45 on 10/28/22
- Next Earnings DateN/A
- Annual Dividend & Yield3.64 (3.22%)
- Most Recent Dividend0.910 on 11/14/22
SECTORS:
Oil – International Integrated
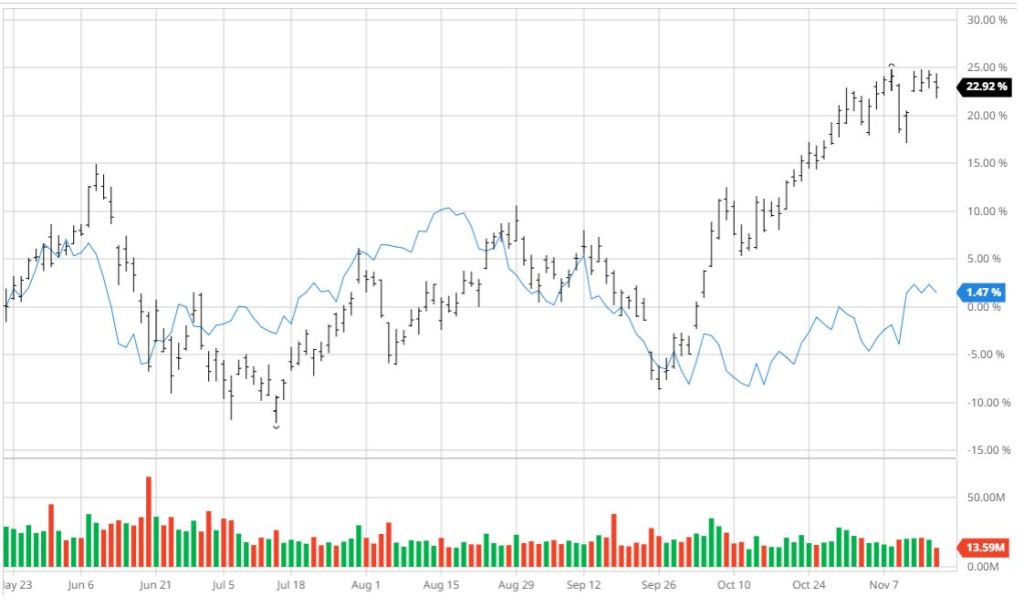
XOM vs S&P 500 % 6M.
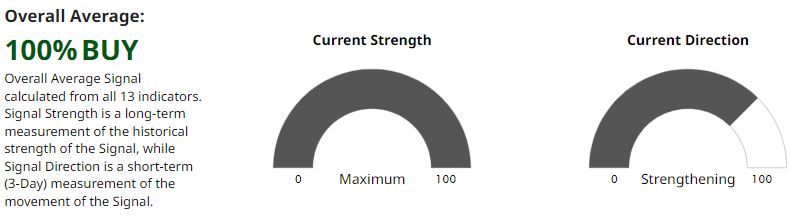

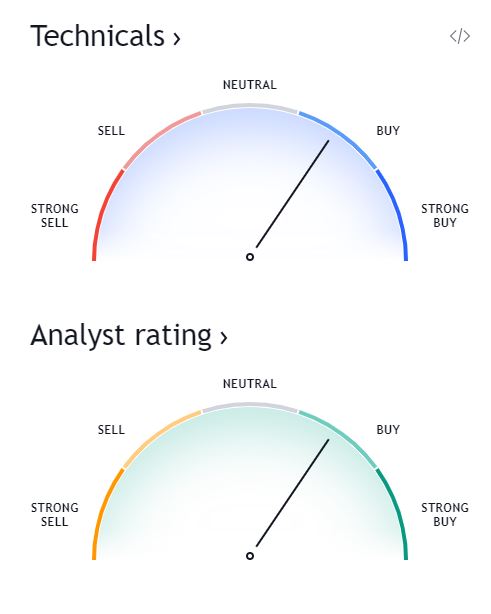
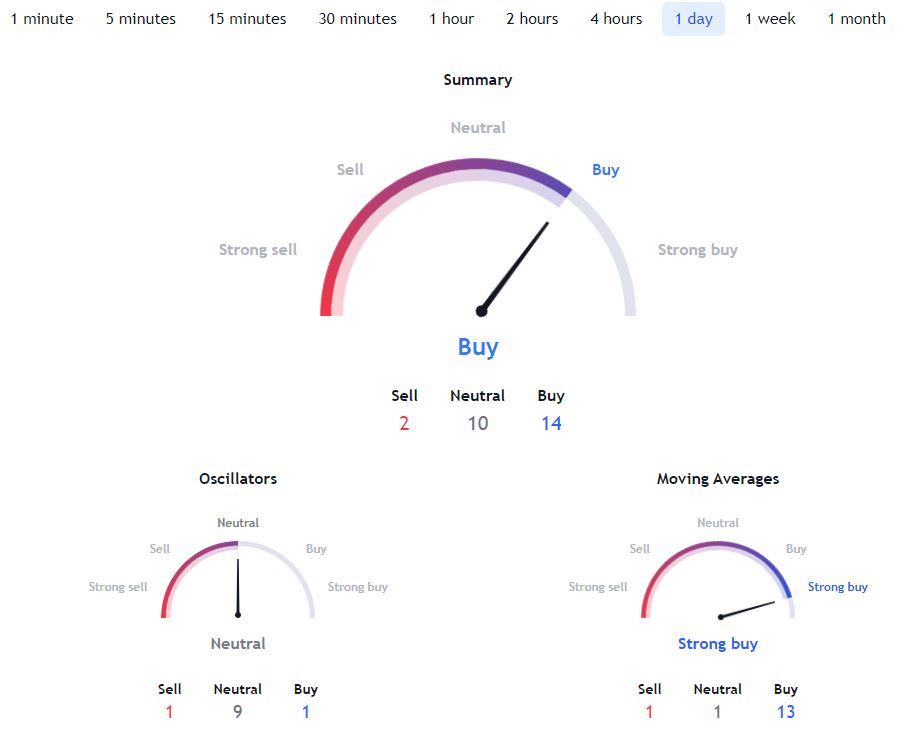
Ratings Breakdown:

MacroAxis
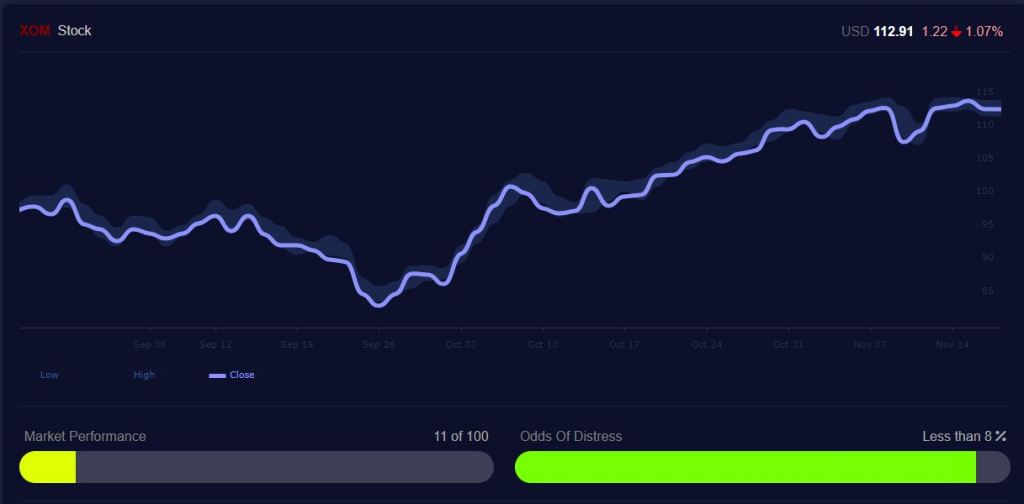
Exxon is selling for 112.91 as of the 17th of November 2022. This is a -1.07 percent decrease since the beginning of the trading day. The stock’s lowest day price was 111.86. Exxon has only a 8 % chance of going through financial distress over the next few years and had a good performance during the last 90 days.
Stock pair correlation analysis:


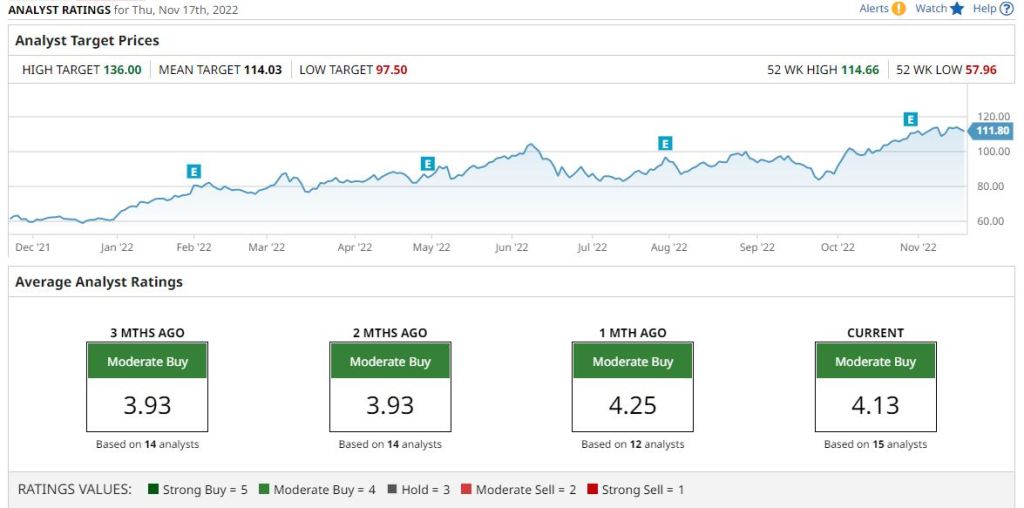
Analysts covering Exxon report their recommendations after researching Exxon’s financial statements, talking to executives and customers, or listening in on Exxon’s conference calls. The current trade recommendation is based on an ongoing consensus estimate among financial analysts covering Exxon Mobil Corp. The Exxon consensus assessment is calculated by taking the average forecast from all of the analysts covering Exxon.
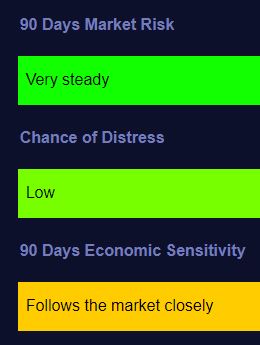
Exxon Stock volatility depicts how high the prices fluctuate around the mean (or its average) price. In other words, it is a statistical measure of the distribution of Exxon daily returns, and it is calculated using variance and standard deviation. We also use Exxon’s beta, its sensitivity to the market, as well as its odds of financial distress to provide a more practical estimation of Exxon volatility.
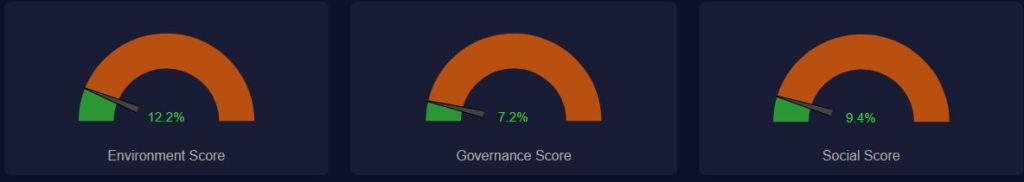
ESG Sustainability:
While most ESG disclosures are voluntary, Exxon’s sustainability indicators can be used to identify proper investment strategies using environmental, social, and governance scores that are crucial to Exxon’s managers and investors.
Exxon’s market sentiment shows the aggregated news analyzed to detect positive and negative mentions from the text and comments. The data is normalized to provide daily scores for Exxon’s and other traded tickers. The bigger the bubble, the more accurate is the estimated score. Higher bars for a given day show more participation in the average Exxon’s news discussions. The higher the estimate score, the more favorable is the investor’s outlook on Exxon.

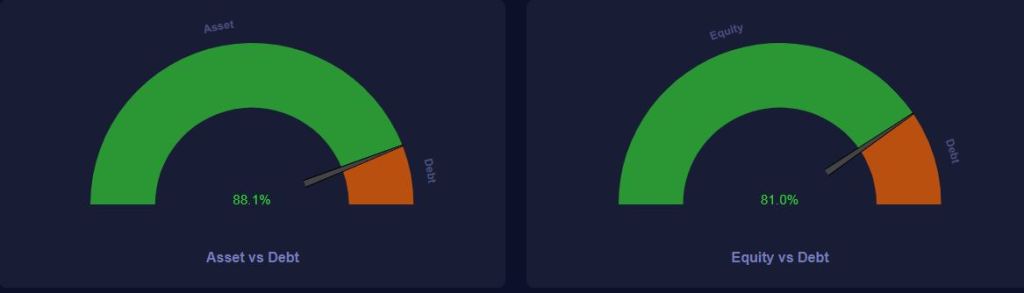
Exxon Current Financial Burden:
Exxon’s liquidity is one of the most fundamental aspects of both its future profitability and its ability to meet different types of ongoing financial obligations. Exxon’s cash, liquid assets, total liabilities, and shareholder equity can be utilized to evaluate how much leverage the company is using to sustain its current operations. For traders, higher-leverage indicators usually imply a higher risk to shareholders. In addition, it helps Exxon Stock’s retail investors understand whether an upcoming fall or rise in the market will negatively affect Exxon’s stakeholders.
Key Takeaways
- Energy prices continue to rise at meteoric rates, which is great for oil related stocks like XOM.
- The energy sector continues to outperform the broader market as oil and gas prices continue to hit the roof.
- Oil producers enjoy the boom: We know it may seem like the commodities crisis and sky high fuel prices are bad for basically everyone, but investors in oil companies have certainly found a silver lining.
- Five global oil majors have all basically smashed through previous records.
- These earnings have obvs been buoyed by crude oil and natural gas hitting multi-decade highs, providing somewhat of a cash cow for Big Oil and triggered a bunch of attacks from politicians around the world, who are calling for a windfall tax on the profits.
- Is the end nigh? Nope, not according to market participants like OPEC member UAE and Goldman Sachs, who say that oil prices are “nowhere near” their peak yet and will likely continue to see a parabolic rise this year, especially as China’s covid recovery sends demand skyrocketing.
- Exxon gets investors Exxcited – Natural gas giant XOM sees prices hit multi-year highs, fuelled by earnings that are running on record high energy prices.
Explore More
The Zacks’s Market Outlook Nov ’22 – Energy Focus
Zacks Investment Research Update Q4’22
The Zacks’s Steady Investor – A Quick Look
Gulf’s Oil Price Web Scraping in R
Towards min(Risk/Reward) – SeekingAlpha August Bear Market Update
Zacks Insights into the Commodity Bull Market
OXY Stock Analysis, Thursday, 23 June 2022
OXY Stock Update Wednesday, 25 May 2022
OXY Stock Technical Analysis 17 May 2022
Bear Market Similarity Analysis using Nasdaq 100 Index Data
Track All Markets with TradingView
Inflation-Resistant Stocks to Buy
A Weekday Market Research Update
Macroaxis AI Investment Opportunity
Investment Risk Management Study
Infographics

Zbynek Burival / Unsplash

Photo by Raymond Kotewicz on Unsplash
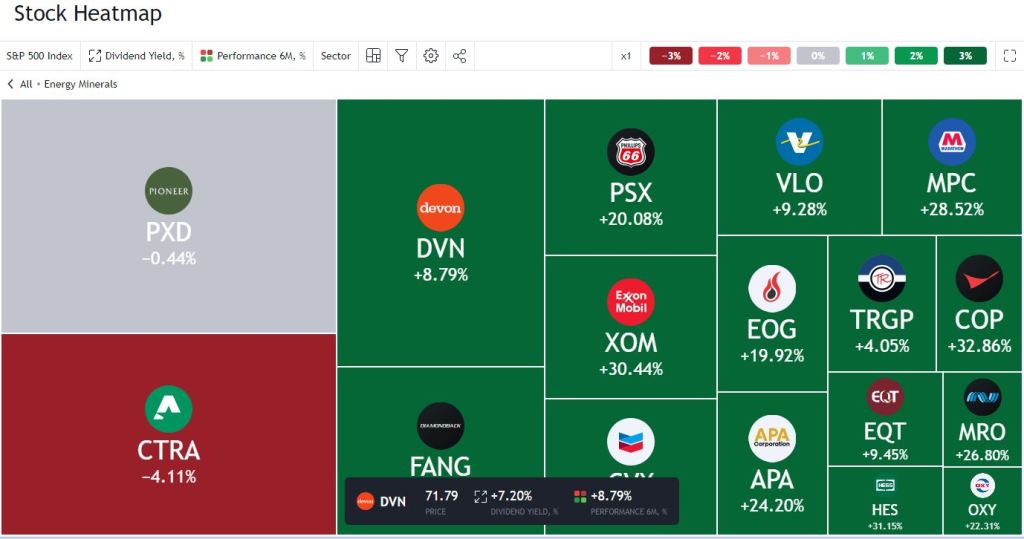
TradingView Stock Heatmaps
Sector Price-to-Earning Ratio

Market Cap:
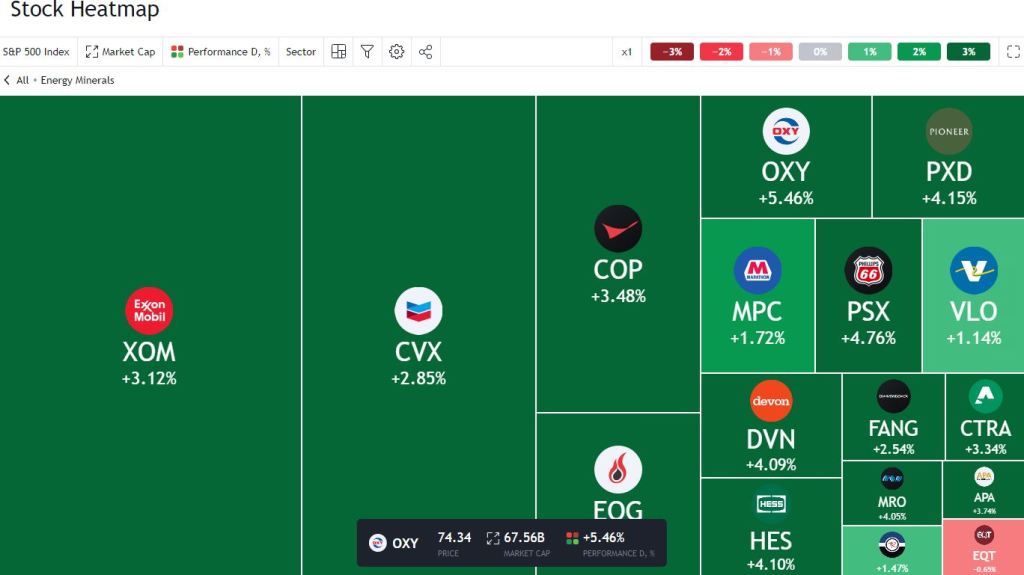
Sector performance % 6M


Make a one-time donation
Make a monthly donation
Make a yearly donation
Choose an amount
Or enter a custom amount
Your contribution is appreciated.
Your contribution is appreciated.
Your contribution is appreciated.

Leave a comment