
12 High-Yield Blue-Chips That Are Perfect For This Bear Market
Jun. 16, 2022 11:00 AM ET
- The commodity futures market thinks inflation will peak in September at 9.2%. The bond market thinks the Fed will hike to 4% by March 2023.
- This bear market could have another 8% to 24% more to fall before bottoming, making low volatility blue-chips one of the best strategies you can use.
- NVS, UL, MO, MMM, BTI, FLIC, ENB, BNS, TD, MMP, EPD, and MURGY are 12 of the best high-yield, low volatility blue-chip bargains on Wall Street today.
- They trade at 10.6X earnings, a very safe 5.7% yield, and are 23% historically undervalued.
- Analysts expect 12.3% long-term returns, just like they’ve delivered for 21 years, beating the S&P, dividend aristocrats, and even the Nasdaq. All while falling 31% during the Great Recession (same as a 60/40), and just 8% in this bear market. In fact, they delivered these market-crushing returns with 20% less annual volatility than the market, making these 12 high-yield blue-chips companies you might want to own if stocks keep falling.
3 Blue Chip Stocks to Buy as the S&P 500 Flirts With Bear Market Territory
The S&P 500 index, a benchmark for the broader stock market, briefly dipped into bear market territory last week, which means the index fell at least 20% in value from recent sustained highs. It has been a difficult year for the stock market and the pain may not be done yet.
Given that uncertainty, it may not be a bad idea for investors to take a look at blue-chip stocks which are well-known, high-quality companies that are leaders in their industries.
Here are three good blue-chip stocks to check out as the S&P 500 flirts with bear territory.
Berkshire Hathaway
While most stocks are trading down a lot this year, Warren Buffett’s company, Berkshire Hathaway (BRK.A -0.34%)(BRK.B -0.16%), has managed to stay roughly flat on the year, widely outperforming the S&P 500.
JPMorgan Chase
America’s largest bank by assets, JPMorgan Chase‘s (JPM -0.06%) stock price has fallen more than 27% this year amid high inflation, rising interest rates, and fears of a recession. Those factors aren’t great for banks because of how linked to the economy they are. Investors were also not pleased on recent earnings calls when JPMorgan guided for expense growth of more than 8% in 2022. But the bank will also benefit from rising interest rates, which most banks do.
Mastercard
The sprawling payments network Mastercard (MA 1.31%) has built a strong moat. It helps businesses and consumers process payments in more than 200 countries and has developed one of the largest payment rails in the world. The company has issued nearly 2.9 billion credit and debit cards and saw $7.7 trillion of payments go through its network in 2021.
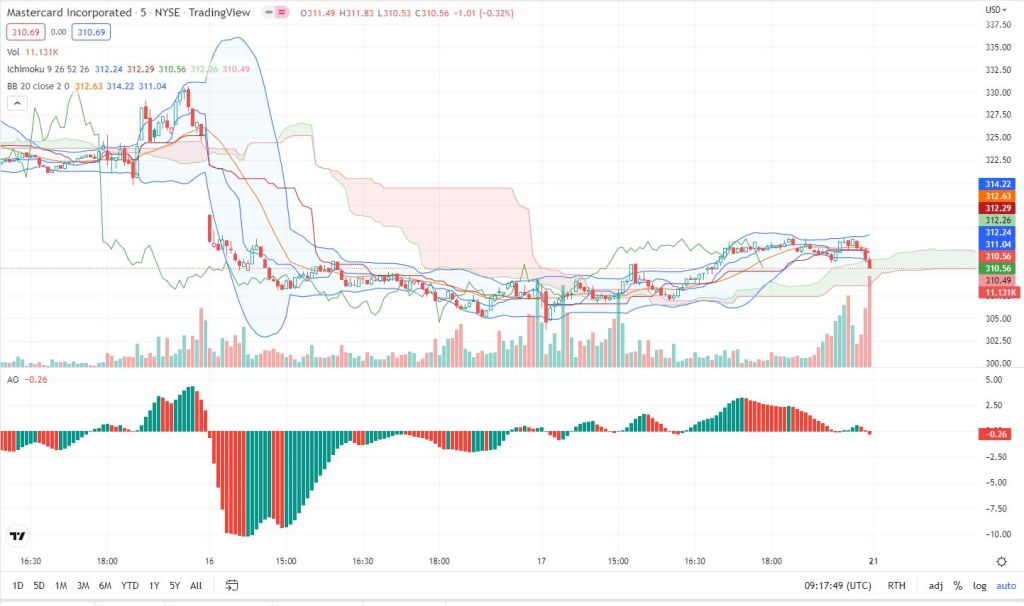
TradingView Technical Analysis
Let’s Get Started: Introduction for Niewbies
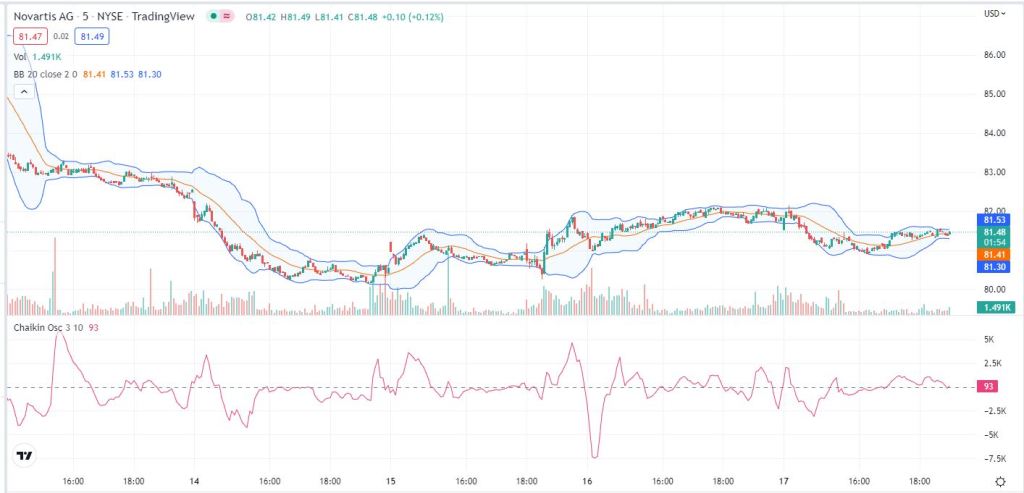
$NVS
$UL

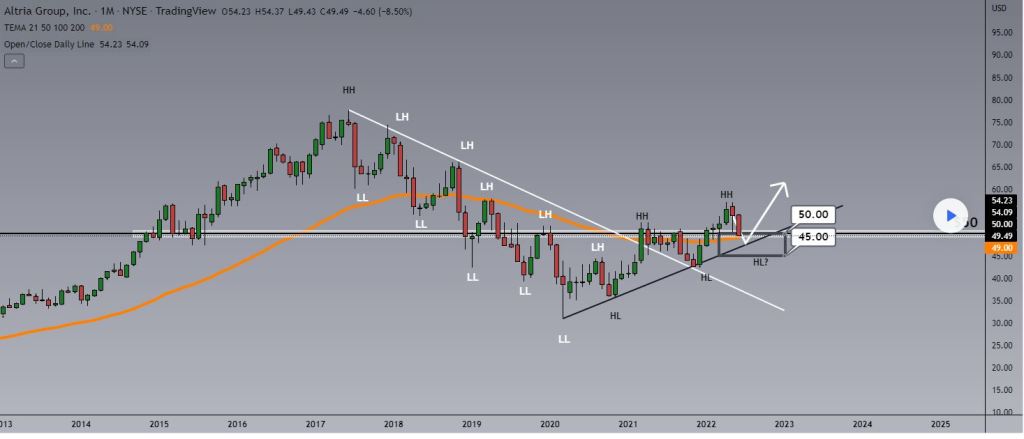
$MMM


$BTI


$FLIC

$ENB

$BNS

$TD

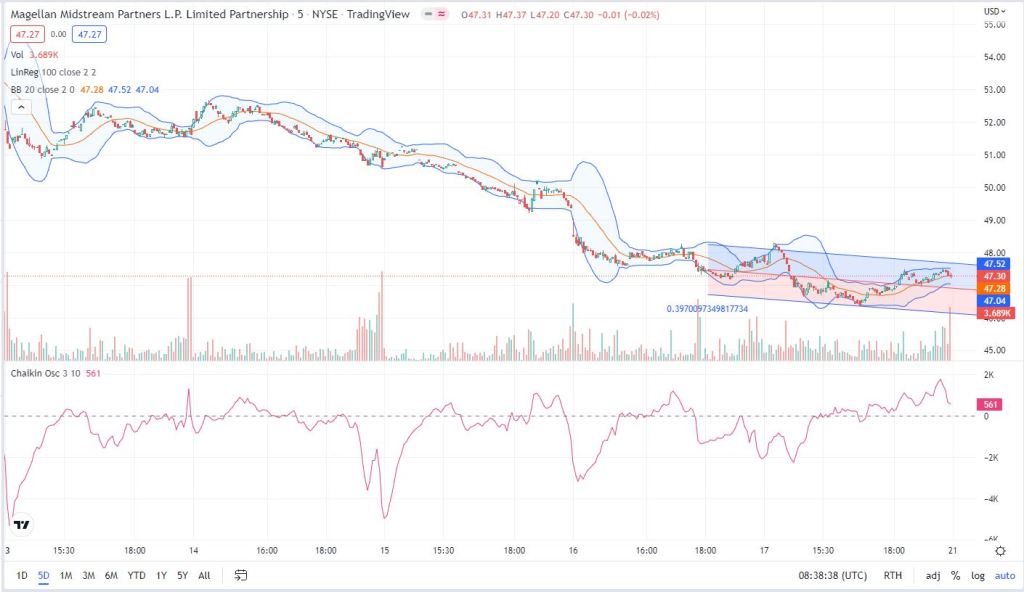
$MMP
$EPD

$MURGY

Financial summary of Muenchener Rueckver Ges with all the key numbers
The current MURGY market cap is 32.658B USD. The company’s EPS TTM is 2.48 USD, dividend yield is 3.46%, and P/E is 9.54. Next Muenchener Rueckver Ges earnings date is August 9, the estimation is 0.49 USD.

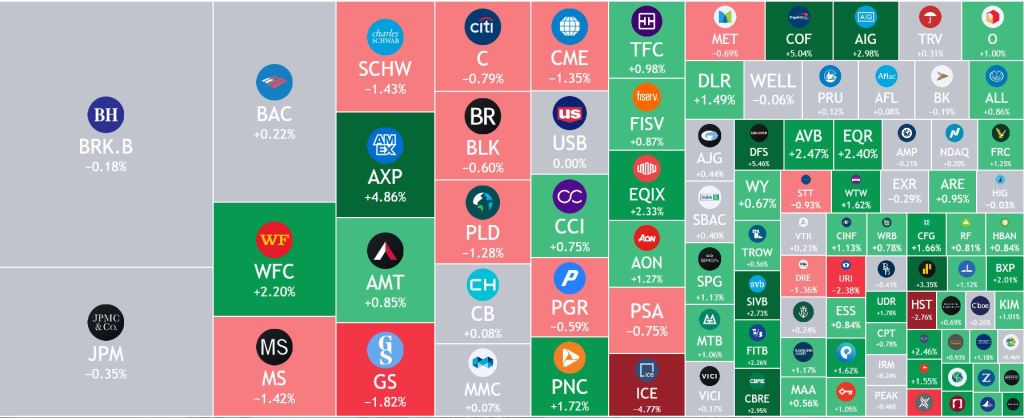
Commercial Services Heatmap
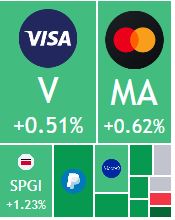
$MA forecasts
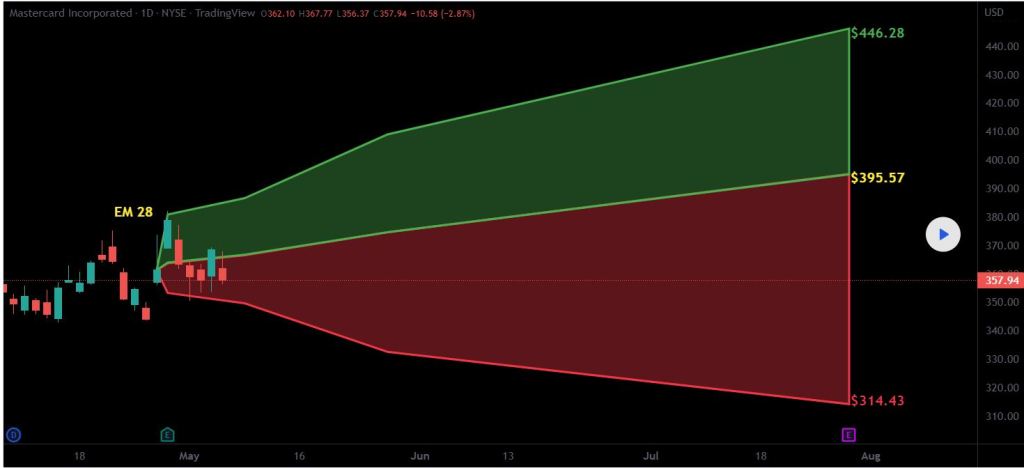
$MA with a Bullish outlook following its earnings #Stocks.
The PEAD projected a Bullish outlook for $MA after a Positive over reaction following its earnings release placing the stock in drift B with an expected accuracy of 50%.

Bias: Positive.
Sentiment: Optimistic.
Emoji (emotion): Comprehensive 🧭.
Null Hypothesis: Buy.
Alternative Hypothesis: Sell.

Rate of change as delta in price and time in terms of fibonacci shows the safest levels to invest. Usually opportunity comes inside coldest colors. Green is considered as ALL IN.
Crossing black fib lines confirms a signal.
Finance Heatmap


Leave a comment