
TradingView is a powerful technical analysis tool for both novice and experienced investors and traders. It is reliable, comprehensive, and has most of what you need day-to-day when trading.
See more, do more:
Indicators help you take all the price data before you and reduce it down to visual patterns you can more easily digest and analyze. As a result, they’re super valuable when attempting to discover new trading opportunities.
At present, the basic plan only supports 3 indicators per chart, but you can easily increase this by jumping over to one of our upgraded plans. Just check out the link for more deets.
Contents:
- This Week Ideas Tuesday, 13 Dec ’22
- How to Get Going
- Take charts for a walk
- Discover, plan, trade
- Enhance your ideas
- Community Feedback
- The highest-rated finance app
- New global screener
- FAQ
- References
This Week Ideas Tuesday, 13 Dec ’22
Relationship Between Business cycle & Sentiment cycle @Money_Dictators
The business cycle consists of 6 phases/stages:
- Expansion
- Peak
- Recession
- Depression
- Trough
- Recovery”
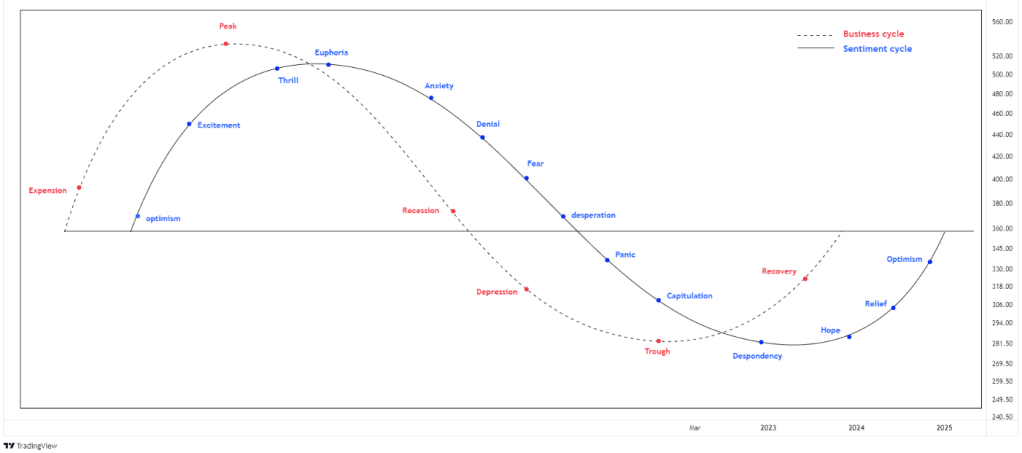
Recession is a scary word for any country An economic recession occurs when the economy shrinks. During recessions, even businesses close their doors. Even an individual can see these things with his own eyes:
1. People lose their jobs
2. Investment lose their value
3. Business suffers losses
Note: The recession is part of an economic cycle .


- Moving Average
A moving average helps cut down the amount of noise on a price chart. Look at the direction of the moving average to get a basic idea of which way the price is moving. If it is angled up, the price is moving up (or was recently) overall; angled down, and the price is moving down overall; moving sideways, and the price is likely in a range.
A moving average can also act as support or resistance
- Bollinger Bands
Bollinger Bands are a form of technical analysis that traders use to plot trend lines that are two standard deviations away from the simple moving average price of a security. The goal is to help a trader know when to enter or exit a position by identifying when an asset has been overbought or oversold. Bollinger Bands were designed by John Bollinger .
Bollinger Bands help by signaling changes in volatility . For generally steady ranges of a security, such as many currency pairs, Bollinger Bands act as relatively clear signals for buying and selling
- Relative Strength Index ( RSI )
The relative strength index ( RSI ) is a momentum indicator used in technical analysis . RSI measures the speed and magnitude of the pair’s recent price changes to evaluate overvalued or undervalued conditions in the price of that pair.
It can also indicate pairs that may be primed for a trend reversal or corrective pullback in price. It can signal when to buy and sell.
The RSI is displayed as an oscillator (a line graph) on a scale of zero to 100Traditionally, an RSI reading of 70 or above indicates an overbought situation. A reading of 30 or below indicates an oversold condition.
- MACD(Moving Average Convergence Divergence)
The concept behind the MACD is fairly straightforward. Essentially, it calculates the difference between an instrument’s 26-day and 12-day exponential moving averages ( EMA ). In calculating their values, both moving averages use the closing prices of whatever period is measured.
On the MACD chart, a nine-period EMA of the MACD itself is also plotted. This line is called the signal line, which acts as a trigger for buy and sell decisions. The MACD is considered the “faster” line because the points plotted move more than the signal line, which is regarded as the “slower” line.
- On-Balance Volume (OBV)
On-balance volume (OBV) is a technical trading momentum indicator that uses volume flow to predict changes in the price.
The theory behind OBV is based on the distinction between smart money – namely, institutional investors – and less sophisticated retail investors. As mutual funds and pension funds begin to buy into an issue that retail investors are selling, volume may increase even as the price remains relatively level. Eventually, volume drives the price upward. At that point, larger investors begin to sell, and smaller investors begin buying.
StockMarket Update Monday, August 1, 2022
Inspired by the TradingView Community and The Pup’s Weekend Dig
How to Get Going
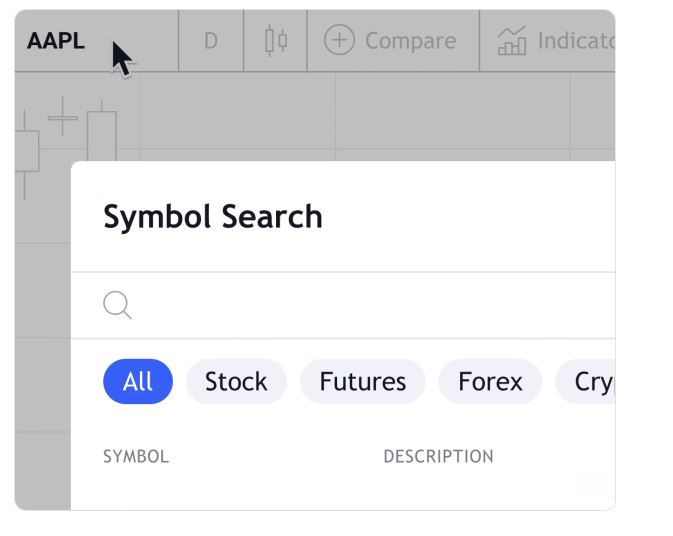
When you open a chart, it’ll display a default symbol, or the last symbol you opened. To change, simply click or start typing the symbol / company name.

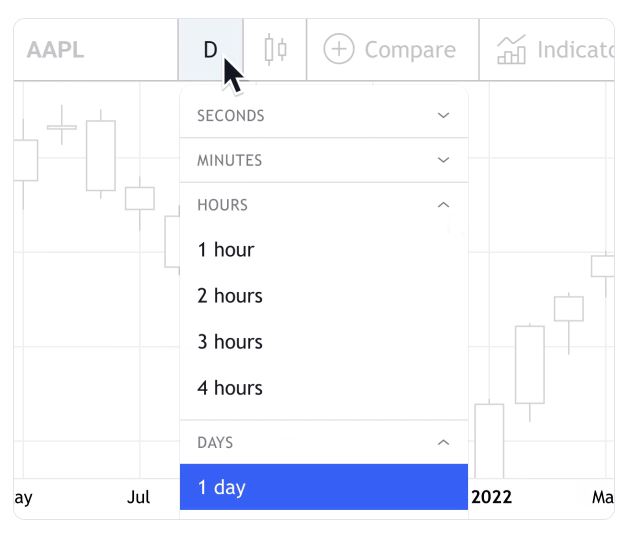
| The chart also defaults to a daily candlestick layout. Adjust your timeframe and choose from 12 chart types using the tabs along the top of the chart. |

| You can overlay indicators or fundamental data using the tab at the top, and get explanations for each via the question mark next to their names on the menu screen. |

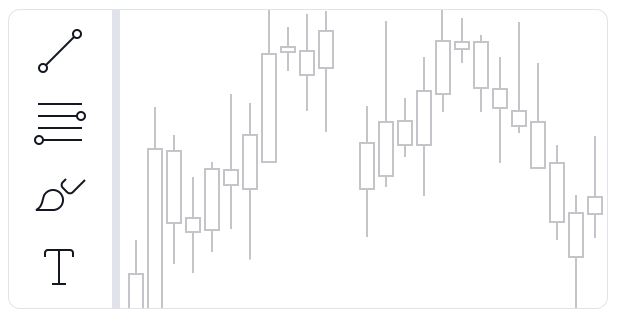
| Lastly, start playing with the side navigation to add trendlines, shapes and text to annotate your charts. |
Don’t forget you can also gather all kinds of tips, help, and information from the friendly community of TradingView users too.
Take charts for a walk
So you’ve got to grips with our charting basics – now it’s time to let this puppy out for a real play. Here are four of our most important tools to try out next.
| Multiple charts |
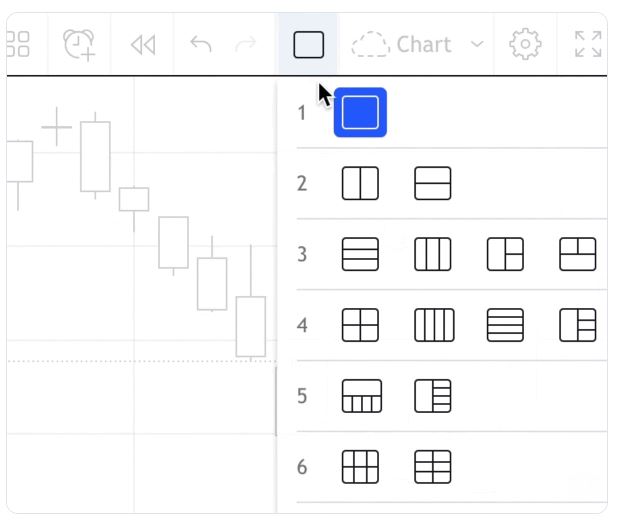
| Use the multi chart function on our upgraded plans to view up to eight charts per tab – much easier for comparing symbols and switching between views. |
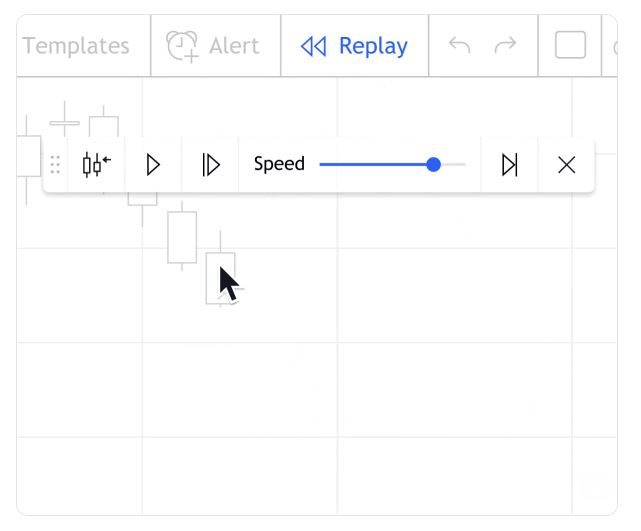
Bar Replay:
| Activate the Bar Replay tool to skip back in time and replay the market, so you can test your ideas and analyze your strategies before you use them in the wild. |
Take a look at spread charts to get a unique perspective on the markets, and compare a symbol with another variable – such as a numerical value or different symbol.
Upgrade to a paid plan to get a fuller range of time intervals, from 1 second to 1 month – plus with a Premium plan you can even set your own custom time intervals to fine-tune your setup.
Time to take your next big leap? Don’t forget you can test drive our Pro, Pro+, or Premium accounts for 30 days, completely free.
Discover, plan, trade
- Discover. Use our stocks, forex and crypto screeners, or heatmaps to filter down to your key targets; then set up quick watchlists to easily flick between them.
- Plan. Analyze what matters to you with our industry-leading charts, and never miss a market movement again with our instant alerts.
- Trade. When you’re ready to practice your strategies, try our free ‘paper trading’ tools without risking real cash.
Enhance your ideas
- Go social
Check out Editors’ Picks for the latest and greatest inspiration from across asset classes, join our millions-strong chatrooms for real time analysis – even create your own chart art. The markets have never been more social.
- Download our desktop app
Make the most of the markets with our specially-designed desktop app. Get extra power, speed and flexibility, all with the same UX you know and love. Available for PC, Mac, and Linux.
- Start learning Pine Script
Smart people build smart indicators and strong strategies. We made Pine Script to help them. Our proprietary programming language is simple to learn, lightning fast and built for you. Try it out and see what it can do for your trading.
Community Feedback
A guide on curing FOMO, a breakdown of the best ways to use Moving Averages, and a look at early-stage NFT investing. All that, plus, Broadcom’s HUGE VMware buyout, and Luna 2.0.
The highest-rated finance app
- Push notifications
- Watchlists
- Charts
- Paper Trading
- Ideas and News
- Widgets
New global screener
Traders can now screen the entire world looking for interesting companies and symbols. Our new screener allows you to scan global markets discovering everything from Europe to Asia and beyond.
FAQ
- What is better than TradingView?
The best alternative is MetaTrader, which is free. Other great apps like TradingView are Good Crypto, TabTrader, HaasOnline and Protrader. TradingView is mainly a Stock Trading App but alternatives to it may also be Cryptocurrency Exchanges or Personal Finance Tools.
- What are the benefits of TradingView?
- 10 indicators per chart.
- 4 charts in one layout.
- 100 server-side alerts.
- 10 saved chart layouts.
- Intraday exotic charts.
- Charts based on custom formulas.
- Chart data export.
- Indicators on indicators.
- Do you need a broker to trade on TradingView?
You can also use the proprietary Paper Trading simulator: trades are emulated on our servers and no broker account is needed for this.
- Is TradingView free?
Pricing. TradingView has four account plans: one free and three paid. Billing options are offered as monthly, yearly and every two years. Each paid plan comes with a 30-day free trial.
- Can you trade stocks on TradingView?
In short, if your broker has a CQG option, and you have a CQG-powered account with them, you can trade through TradingView. Log into your free or upgraded TradingView account. If you have a CQG-powered trading account – open the Trading Panel on the chart. If you don’t, go get a demo account to start with.
- Which is the best buy sell indicator?
Stochastics are a favored technical indicator because they are easy to understand and have a relatively high degree of accuracy. It falls into the class of technical indicators known as oscillators. The indicator provides buy and sell signals for traders to enter or exit positions based on momentum.
- What can you do on TradingView?
Using TradingView can boost your knowledge of markets, methods, and techniques, while allowing you to perfect your charting and trading skills. Insights from the community can also help you make profitable decisions.
- Is there a TradingView app?
The TradingView mobile application is available on the AppStore (iOS 14.0 or later) as well as on Google Play (Android 7.0 or later).
- Which technical indicator is the most accurate?
- Support. …
- Resistance. …
- Moving Average (MA) …
- Exponential Moving Average (EMA) …
- Moving Average Convergence Divergence (MACD) …
- Relative Strength Index (RSI) …
- Bollinger Bands. …
- Stochastic Oscillator.
- How do you know when to buy a stock signal?
By plotting a 200-day and 50-day moving average on your chart, a buy signal occurs when the 50-day crosses above the 200-day. A sell signal occurs when the 50-day drops below the 200-day.
References
TradingView Education Tutorial
A Beginner’s Guide to TradingView
TradingView Tutorial For Beginners 2021 – Master TradingView In Less Than 30 Minutes


Leave a comment