$OXY Bearish Sentiment – In Line with Energy Sector
Photo by Ishant Mishra on Unsplash Contents:
SA Analysis TradingView Barchart Analysis DESCRIPTION: SECTORS: OVERVIEW: GROWTH: PER-SHARE INFORMATION: Explore More
Occidental Petroleum: Now At 3.5x Free Cash Flow, This Is Cheap
Buffett adds to Occidental stake with buys of another 9.6M shares
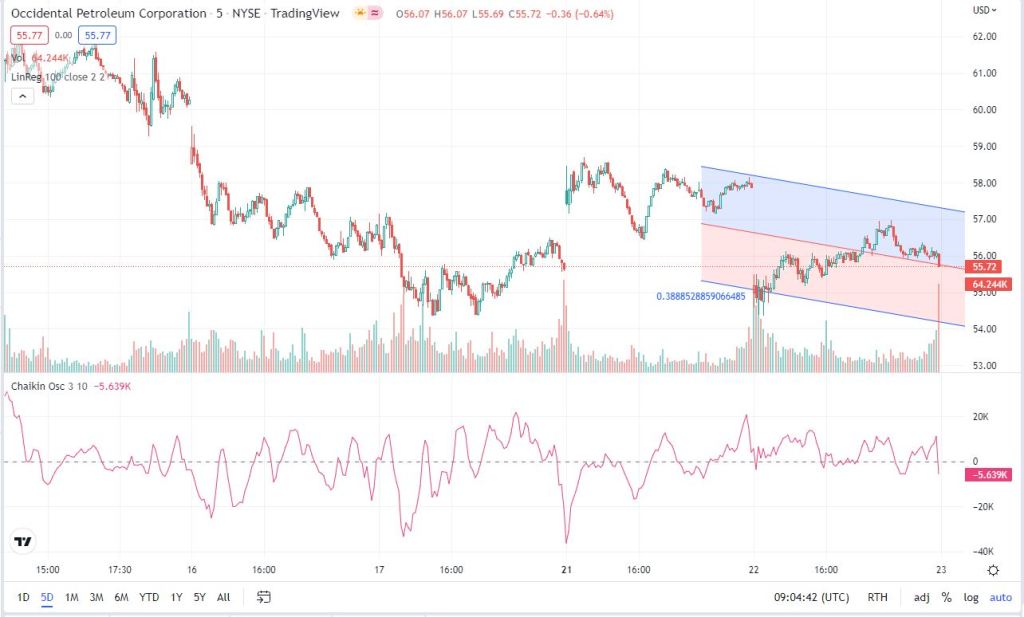
OSCILLATORS
MOVING AVERAGES
$OXY Bearish Sentiment – In Line with Energy Sector
Read More
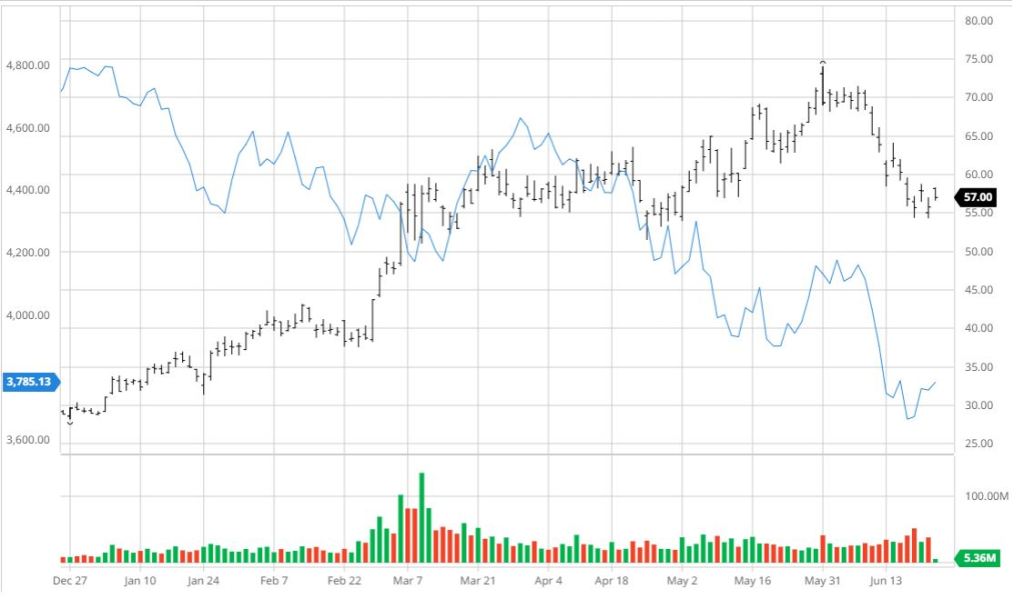
6-month $OXY chart vs S&P 500 index (blue curve)
DESCRIPTION:
Occidental Petroleum Corporation is an integrated oil and gas company, with significant exploration and production exposure. The company is also a producer of a variety of basic chemicals, petrochemicals, polymers and specialty chemicals. The company conducts its operations through three segments: Oil and Gas, Chemical, and Midstream and Marketing. Oil and Gas segment explores, develops, produces and markets crude oil, natural gas liquids, condensate and natural gas. The company has operations in the U.S. as well as international locations. Chemical segment works under the company’s wholly-owned subsidiary, Occidental Chemical Corporation. It manufactures and markets polyvinyl chloride resins, chlorine and caustic soda. Midstream and Marketing segment encompasses operations that gather, treat, process, transport, store, trade and market crude oil, natural gas, NGL, condensates and carbon dioxide. It also offers these services to third parties.
Company Info
Occidental Petroleum Corp 5 GREENWAY PLAZA SUITE 110HOUSTON TX 77046 USA
P: 713-215-7000
SECTORS:
SIC-1311 Crude Petroleum & Natural Gas Oil – US Integrated Indices S&P 500 Indices S&P 500 Energies Indices Russell 1000 Indices Russell 3000 Indices S&P ESG Top 100 Stocks
Key Statistics
OVERVIEW:
Market Capitalization, $K 52,267,140 Shares Outstanding, K 937,191 Annual Sales, $ 25,956 M Annual Net Income, $ 2,322 M Last Quarter Sales, $ 8,349 M Last Quarter Net Income, $ 4,876 M 60-Month Beta 1.92 % of Insider Shareholders 0.31% % of Institutional Shareholders 86.15% Float, K 934,286 % Float 99.69% Short Volume Ratio 0.63
GROWTH:
1-Year Return 83.67% 3-Year Return 10.92% 5-Year Return -6.85% 5-Year Revenue Growth 157.24% 5-Year Earnings Growth 352.48% 5-Year Dividend Growth -98.69%
Most Recent Earnings 2.12 on 05/10/22 Next Earnings Date 08/02/22 Earnings Per Share ttm 4.79 EPS Growth vs. Prev Qtr 43.24% EPS Growth vs. Prev Year 1,513.33% Annual Dividend Rate, $ 0.52 Annual Dividend Yield 0.90% Most Recent Dividend 0.130 on 06/09/22 Next Ex-Dividends Date 06/09/22 Dividend Payable Date 07/15/22 Dividend Payout Ratio 2.93% Most Recent Split 2-1 on 08/16/06
Stock Comparison:
Symbol OXY COP HES Company Occidental Petroleum Corp Conocophillips Hess Corp
Price Information Exchange NYSE NYSE NYSE Open 58.17 93.75 104.47 High 58.29 94.20 104.74 Low 56.62 92.28 102.29 Last 56.93 92.35 103.06 Change +1.16 -0.71 -0.28 % Change +2.08% -0.76% -0.27% Volume 5,956,427 1,358,029 237,467 20-Day Average Volume 28,518,609 8,669,898 2,545,468 Previous Close 55.77 93.06 103.34 Industry Oil – US Integrated Oil – US Integrated Oil – US Integrated Has Options Yes Yes Yes
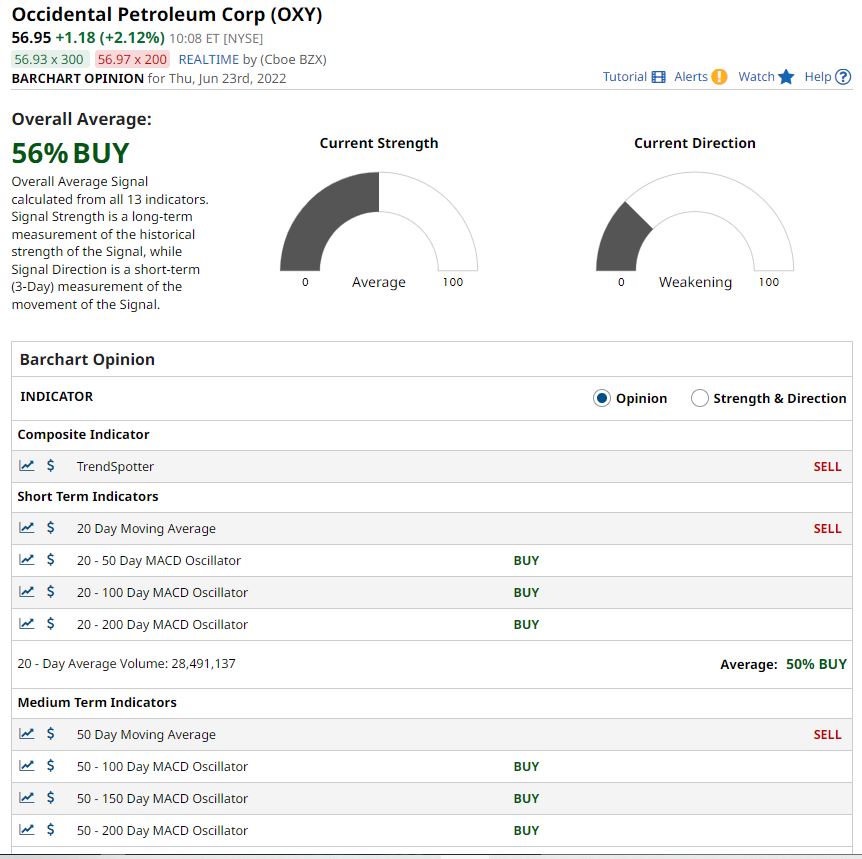
Technicals 20-Day Moving Average 64.43 110.58 119.63 20-Day Raw Stochastic 12.59% 4.78% 9.61% 20-Day Relative Strength 42.88% 38.56% 39.49% Weighted Alpha +48.57 +42.79 +18.49 Today’s Opinion 56% Buy 40% Buy 40% Buy Previous Opinion 40% Buy 40% Buy 40% Buy Last Month’s Opinion 100% Buy 100% Buy 100% Buy
Performance 5-Days %Chg -5.79% since 06/15/22 -14.92% since 06/15/22 -11.79% since 06/15/22 Low 54.30 on 06/22/22 91.46 on 06/22/22 100.36 on 06/22/22 High 59.57 on 06/16/22 106.21 on 06/16/22 114.53 on 06/16/22 1-Month %Chg -13.19% since 05/23/22 -14.68% since 05/23/22 -11.65% since 05/23/22 Low 54.30 on 06/22/22 91.46 on 06/22/22 100.36 on 06/22/22 High 74.04 on 05/31/22 124.08 on 06/08/22 131.43 on 06/08/22 3-Month %Chg -5.10% since 03/23/22 -10.87% since 03/23/22 -2.71% since 03/23/22 Low 51.53 on 04/25/22 88.77 on 04/27/22 98.77 on 04/27/22 High 74.04 on 05/31/22 124.08 on 06/08/22 131.43 on 06/08/22 6-Month %Chg +96.85% since 12/23/21 +30.66% since 12/23/21 +40.62% since 12/23/21 Low 28.20 on 12/27/21 70.46 on 12/27/21 72.38 on 12/27/21 High 74.04 on 05/31/22 124.08 on 06/08/22 131.43 on 06/08/22
Key Statistics Market Capitalization, $K 52,267,140 120,368,448 32,165,918 Shares Outstanding, K 937,191 1,293,450 311,263 Annual Sales 25,956,000,000 48,349,000,000 7,583,000,000 Annual Net Income 2,322,000,000 8,079,000,000 559,000,000 Last Quarter Sales 8,349,000,000 19,291,000,000 2,371,000,000 Last Quarter Net Income 4,876,000,000 5,759,000,000 417,000,000 60-Month Beta 1.92 1.34 1.66 Per-Share Information Most Recent Earnings 2.12 on 05/10/22 3.27 on 05/05/22 1.30 on 04/27/22 Latest Earnings Date 08/02/22 08/02/22 07/27/22 Most Recent Dividend 0.130 on 06/09/22 0.460 on 05/16/22 0.375 on 06/14/22 Next Ex-Dividends Date 06/09/22 06/27/22 06/14/22 Ratios Price/Earnings ttm 12.08 11.57 40.35
Explore More


Leave a comment