Tag: stockmarket
-
Stock Market ’22 Round Up & ’23 Outlook: Zacks Strategy vs Seeking Alpha Tactics

Featured Photo by Pixabay Contents: Zacks Market Research 2022 has been a strong year for jobs: Commodity markets: Energy: Global Investments: In the Zacks October 2022 Chief Investment Officer (CIO) survey, the CIOs made it fairly clear how they felt about investing outside the US. Answer: not great. Corporate High Yield and Investment Grade Bonds:In…
-
XOM SMA-EMA-RSI Golden Crosses ’22

Featured Photo by Johannes Plenio on Pexels. Today we will discuss the XOM stock using most basic technical trading indicators (TTIs) within the Python library ta-lib. Recall that this library is widely used by algo traders requiring to perform technical analysis of financial market data. It includes 150+ indicators such as ADX, MACD, RSI, Stochastic,…
-
A Roadmap from Data Science to BI via ML

The blog post presents a comprehensive roadmap to Data Science (DS), providing an overview of career prospects, the field’s intersections with Mathematics, Statistics, and Computer Science, and its business relevance. The text details the earning potential of data scientists and the steps towards becoming one, including Data Analysis, Machine Learning, and Business Intelligence. It highlights…
-
Energy E&P: XOM Technical Analysis Nov ’22

Featured Photo by Kayden The last few years offer a case study of how quickly energy markets can shift. According to our recent post, Oil & Gas Exploration and Production (E&P) stays the top energy sector, remaining firmly at Very Attractive to Buy. In the light of what we know about E&P business, let’s take…
-
The Zacks Market Outlook Nov ’22 – Energy

Featured Image by Canva. Let’s review the current Energy Market Outlook to power your investment portfolio with Zack Research. Indeed, Energy is at the heart of development. Energy makes possible the investments, innovations, and new industries that are the engines of jobs, inclusive growth, and shared prosperity for entire economies. What Rapidly Shifting Energy Markets…
-
BTC-USD Freefall vs FB/Meta Prophet 2022-23 Predictions
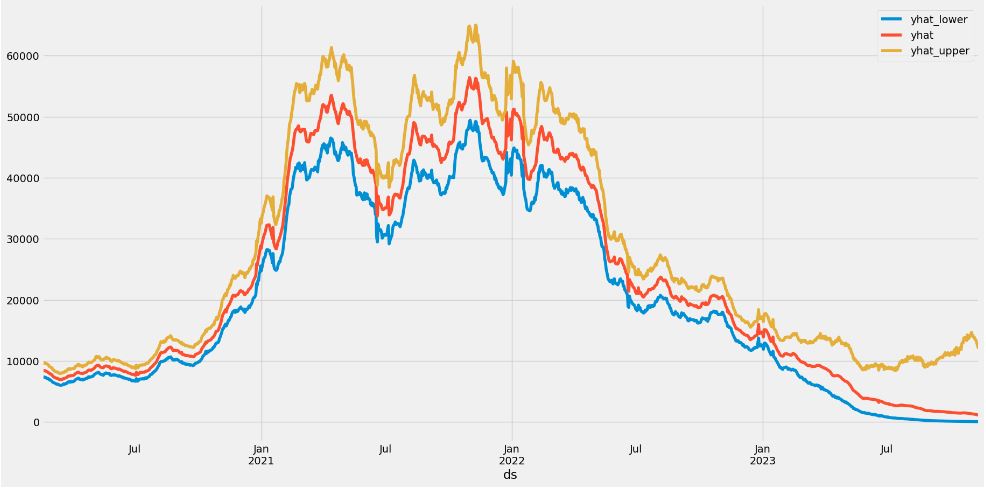
It is widely recognized that crypto price prediction is considered a very challenging task, due to its chaotic (highly volatile) and very complex nature. Nethertheless, accurate predictions can assist crypto investors towards right investing decisions. Why not Predicting BTC-USD Prices Using Facebook’s Prophet? Let’s discuss this state-of-the-art model within the context of BTC-USD 2022-23 price prediction…
-
The $ASML Trading Strategies via the Plotly Stock Market Dashboard

Dr. Dividend has shared an insight into a stock market analysis using Plotly’s interactive Stock Market Dashboard. The rundown explains how to fetch live data using yfinance API, create visuals incorporating moving averages, and craft multiple trading signals, including the use of the MACD and Stochastic Oscillator. The tutorial also guides on saving the final…
-
DJI Market State Analysis using the Cruz Fitting Algorithm

Based upon the Cruz stochastic fitting algorithm and the colab code implementing a Hidden Markov Model, let’s predict the DJI stock returns from 1970 to 2022 and detect three states such as bull (green), sideways (yellow) and bear (red) markets. Let’s set the working directory YOURPATH import osos.chdir(‘YOURPATH’) os. getcwd() and import/install the following libraries…
-
Cloud-Native Tech Autumn 2022 Fair

Let’s dive deeper into the cloud-native tech trends and features to follow in Q4 2022 and beyond. Contents: Markets Services Serverless Cybersecurity DevSecOps ML/AI/IoT Use-Cases Events Training Explore More Infographic
-
Zacks Investment Research Update Q4’22

Featured Photo by Yiorgos Ntrahas on Unsplash Let’s continue exploring the most popular articles, ideas and opinions from Zacks.com. Contents: Update for Monday, October 24 2022 S&P 500: 3,752.75 +86.97 (+2.37%) Dow: 31,082.56 +748.97 (+2.47%) Nasdaq: 10,859.72 +244.87 (+2.31%) Stocks Soared On Friday And For The Week: Investor Fears Create Opportunity Bottom line – right now, stocks are way underpriced, the markets are way oversold, and you…
-
Bear vs. Bull Portfolio Risk/Return Optimization QC Analysis

Based on the Portfolio Allocation and Optimization Algorithm discussed earlier and the related portfolio management, let’s run the Bear vs. Bull QC test of the portfolio P=[MSFT, AAPL, NDAQ] in terms of the Risk/Return Ratio (RRR). We have got a Sharpe ratio of less than one that is considered unacceptable or bad. The risk the…
-
A TradeSanta’s Quick Guide to Best Swing Trading Indicators

This post was motivated by the recent TradeSanta’s insights into Top 6 Indicators For Swing Trading. Key Takeaways: RSI/STOCH – early spot an opportunity EOM – predicts a current trend with confidence MACD – generate robust BUY/SELL signal alerts BB – double check MACD trading signals/alerts VO – simple market sentiment check Use automated trading…
-
The Zacks Steady Investor – A Quick Look

Featured Photo by Bram Naus on Unsplash Let’s look at what is going on in the U.S. markets and the current Zacks’s view for investors to consider (as of Sunday, 9 October 2022).
-
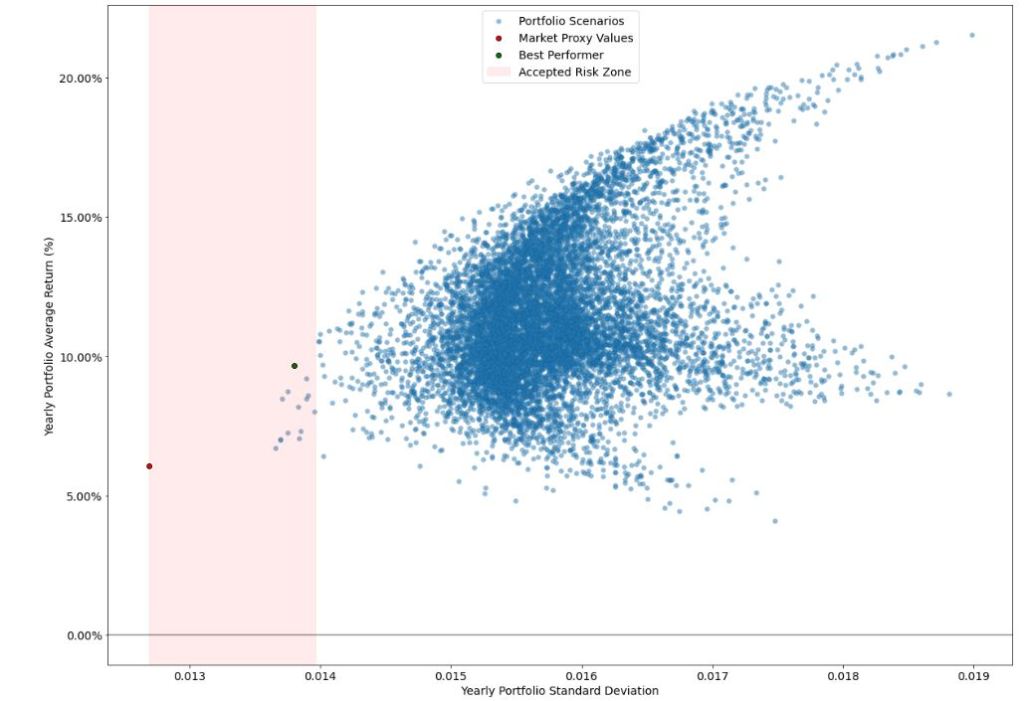
Risk/Return POA – Dr. Dividend’s Positions

Based upon the Portfolio Optimization Algorithm (POA) discussed earlier and the relevant POA QC analysis and comparisons, let’s look at the current stock positions suggested by Dr. Dividend (DD). Let’s define the following POA parameters: benchmark_ = [“^GSPC”,]portfolio_ = [‘AAPL’, ‘GOOG’, ‘COST’, ‘SBUX’, ‘DE’,’SOFI’,’APD’,’UNH’,’SHW’,’NVDA’] start_date_ = “2021-01-01”end_date_ = “2022-10-05”number_of_scenarios = 10000 trade_days_per_year = 252 delta_risk…
-
Portfolio Optimization Risk/Return QC – Positions of Humble Div vs Dividend Glenn
The Portfolio Optimization Algorithm (POA) is used for comparing the top five stock positions of Humble Div (HD) and Dividend Glenn (DG) from 2017 to 2022. The Risk/Return Ratio (RRR) shows HD portfolio as a better performer than DG portfolio and the market. Both portfolios and market are within risk boundaries.
-
Risk/Return QC via Portfolio Optimization – Current Positions of The Dividend Breeder

Featured Image by AbsolutVision on Unsplash Based on the Portfolio Optimization Algorithm (POA) discussed earlier, let’s run the QC test of current positions of The Dividend Breeder in terms of the Risk/Return Ratio (RRR). The POA input is as follows: benchmark_ = [“^GSPC”,]portfolio_ = [‘SCHD’, ‘O’, ‘MSFT’, ‘TGT’, ‘MCD’, ‘PFE’, ‘CSCO’, ‘USB’, ‘KO’, ‘ABBV’,‘CVX’, ‘VZ’,…
-
Stock Portfolio Risk/Return Optimization

The content describes the implementation of an end-to-end Python stock optimization workflow, including steps like importing libraries, setting up key variables, downloading and cleaning stock data, portfolio analysis, and visual representation of the best portfolio. The script aims to minimize the Risk/Return ratio with respect to a market benchmark, providing an efficient way to assess…
-
Invest in AI via Macroaxis Sep ’22 Update

Invest in AI via Macroaxis Sep ’22 Update 4 AI pillars AI thematic idea 20 stocks Asset Allocation Market Capitalization (%) Instrument Composition Market Elasticity Risk/Return Ratio Asse ratings Technical Analysis Correlation Matrix Takeaways Business headlines
-
All Eyes on ETFs Sep ’22

ETF Focus September 2022: Is Now A Good Time To Buy ETFs? Cons and Pros of ETFs Sectors On Watch The Pup’s Weekend Dig Zacks.com SeekingAlpha TradingView Barchart AIolux Macroaxis S&P 500 Related Infographic Commodity trends, cryptocurrency, AI optimization, and more.
-
The Qullamaggie’s OXY Swing Breakouts

Featured Photo by @Nate_Dumlao at @unsplash This post was inspired by the Qullamaggie’s trading journey and its application to the TSLA swing breakouts. Read more about breakouts here. Our current goal is to extend the above breakout analysis to the $OXY stock. Motivation TradingView OXY Analysis: OXY advanced price chart: candlesticks, trading volume, Bollinger bands,…
