
Featured Image by AbsolutVision on Unsplash
Based on the Portfolio Optimization Algorithm (POA) discussed earlier, let’s run the QC test of current positions of The Dividend Breeder in terms of the Risk/Return Ratio (RRR).
The POA input is as follows:
benchmark_ = [“^GSPC”,]
portfolio_ = [‘SCHD’, ‘O’, ‘MSFT’, ‘TGT’, ‘MCD’, ‘PFE’, ‘CSCO’, ‘USB’, ‘KO’, ‘ABBV’,
‘CVX’, ‘VZ’, ‘KMB’, ‘JPM’, ‘LYB’,’SBUX’, ‘BLK’, ‘TROW’, ‘JNJ’, ‘TXN’,’FAGIX’]
start_date_ = “2021-01-01”
end_date_ = “2022-09-28”
number_of_scenarios = 10000
The output Risk-Return 2D map is
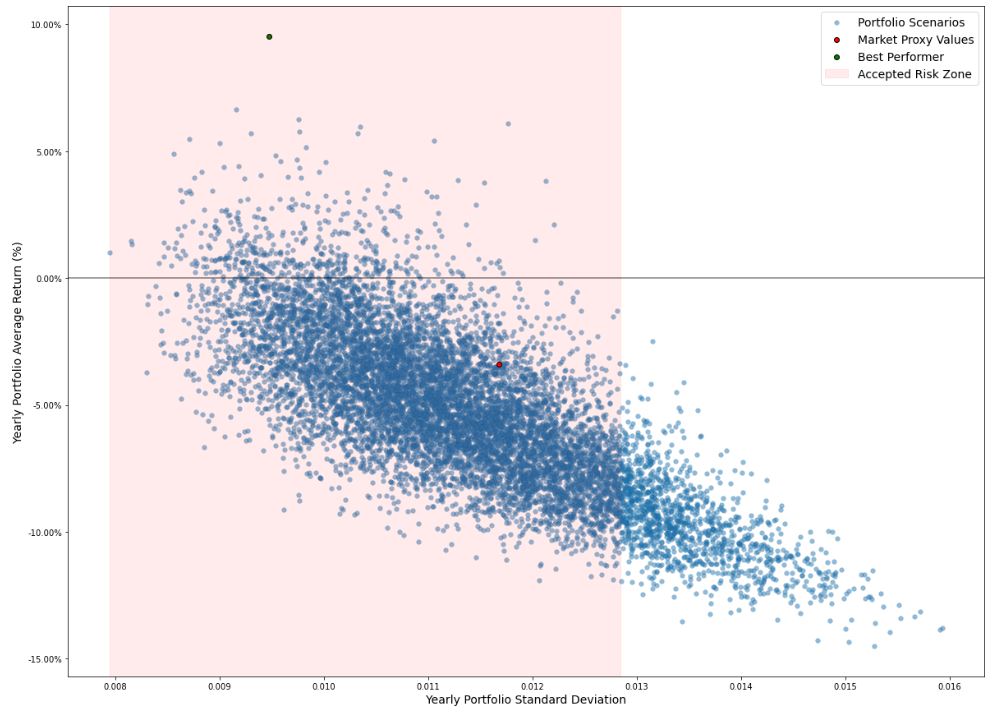
We can see that the Best Performer (BP) yields Return ~ 9% with Volatility ~ 0.0095 well within the accepted risk zone, whereas the market index yields Return ~ -3% with Volatility ~ 0.0115 closer to the right border of the accepted risk zone. This means that RRR(BP)<RRR(^GSPC).
The output table of portfolio distributions is


Leave a comment