Shockwaves from the proposed Binance/FTX deal have sent Bitcoin (BTC-USD) down to the $16,000 level.
Bitcoin, ether pare some of week’s losses after cooler October inflation
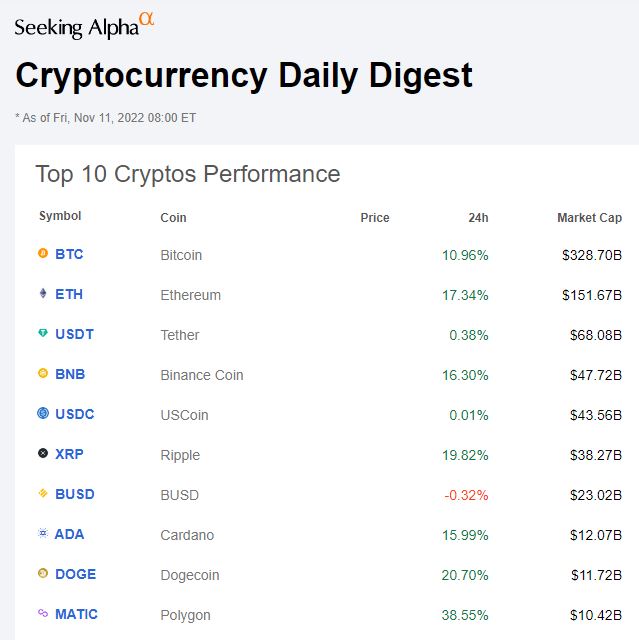
SeekingAlpha Nov 9, 2022, 1:39 PM:
The crypto world was rocked yesterday as one of the biggest names in the biz agreed to buy its rival. While Binance is still doing its due diligence for FTX.com, the deal would be more of a bailout even if it goes through. There are still a load of questions swirling around, but the shockwaves from the event sent Bitcoin (BTC-USD) down by more than 10% to the $17,000 level and will likely have more consequences in the weeks and months to come.
It is widely recognized that crypto price prediction is considered a very challenging task, due to its chaotic (highly volatile) and very complex nature. Nethertheless, accurate predictions can assist crypto investors towards right investing decisions.
Why not Predicting BTC-USD Prices Using Facebook’s Prophet?
Recently, in an attempt to develop a model that could capture seasonality in time-series data, Facebook developed the famous Prophet model that is publicly available for everyone. Prophet is able to capture daily, weekly and yearly seasonality along with holiday effects, by implementing additive regression models.
Let’s discuss this state-of-the-art model within the context of BTC-USD 2022-23 price prediction based on the available historical data since 2020-02-16.
- Let’s set up the working directory YOURPATH and import/install the key libraries
import pandas as pd
import plotly.express as px
import os
os.chdir(‘YOURPATH’)
os. getcwd()
import requests
import numpy as np
import matplotlib.pyplot as plt
from math import floor
from termcolor import colored as cl
plt.rcParams[‘figure.figsize’] = (20, 10)
plt.style.use(‘fivethirtyeight’)
!pip install prophet
from prophet import Prophet
We need to read the BTC historical data
def get_crypto_price(symbol, exchange, start_date = None):
# This function reads the data using the API key YOUR_API_KEY
api_key = 'YOUR_API_KEY'
api_url = f'https://www.alphavantage.co/query?function=DIGITAL_CURRENCY_DAILY&symbol={symbol}&market={exchange}&apikey={api_key}'
raw_df = requests.get(api_url).json()
df = pd.DataFrame(raw_df['Time Series (Digital Currency Daily)']).T
df = df.rename(columns = {'1a. open (USD)': 'Open', '2a. high (USD)': 'High', '3a. low (USD)': 'Low', '4a. close (USD)': 'Close', '5. volume': 'Volume'})
for i in df.columns:
    df[i] = df[i].astype(float)
df.index = pd.to_datetime(df.index)
df = df.iloc[::-1].drop(['1b. open (USD)', '2b. high (USD)', '3b. low (USD)', '4b. close (USD)', '6. market cap (USD)'], axis = 1)
if start_date:
    df = df[df.index >= start_date]
return df
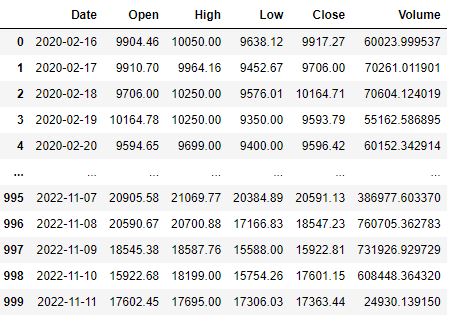
btc = get_crypto_price(symbol = ‘BTC’, exchange = ‘USD’, start_date = ‘2019-01-01’)
btc
df=btc
df.tail()
print(df.info())
print(df.describe())
<class 'pandas.core.frame.DataFrame'>
DatetimeIndex: 1000 entries, 2020-02-16 to 2022-11-11
Data columns (total 5 columns):
 #   Column  Non-Null Count  Dtype
---  ------  --------------  -----
 0   Open    1000 non-null   float64
 1   High    1000 non-null   float64
 2   Low     1000 non-null   float64
 3   Close   1000 non-null   float64
 4   Volume  1000 non-null   float64
dtypes: float64(5)
memory usage: 46.9 KB
None
               Open          High           Low         Close         Volume
count   1000.000000   1000.000000   1000.000000   1000.000000    1000.000000
mean   30401.391220  31244.743820  29437.728570  30408.993910   91693.151779
std    17106.428249  17580.008382  16548.616967  17099.220364   83448.626310
min     4800.010000   5365.420000   3782.130000   4800.000000   15805.447180
25%    12887.482500  13180.432500  12709.580000  12957.157500   45710.092039
50%    30306.575000  31394.450000  29288.285000  30306.585000   64058.994918
75%    44405.345000  45804.717500  43017.272500  44404.550000   97325.988740
max    67525.820000  69000.000000  66222.400000  67525.830000  760705.362783
df.reset_index(inplace=True)
df
df.rename(columns={‘index’: ‘Date’}, inplace=True)
df
- Let’s plot the data
px.area(df, x=’Date’, y=’Close’)

px.box(df, y=’Close’)
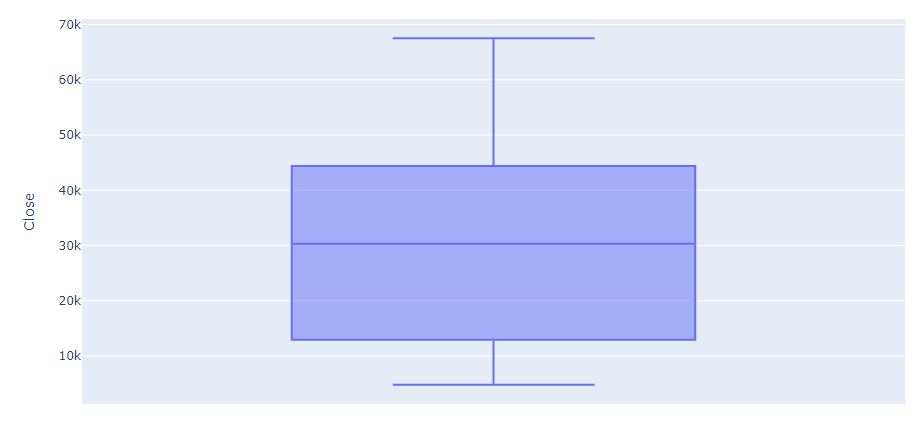
- Let’s prepare our data and perform 1-year predictions
from statsmodels.base.transform import BoxCox
bc= BoxCox()
df[“Close”], lmbda =bc.transform_boxcox(df[“Close”])
data= df[[“Date”, “Close”]]
data.columns=[“ds”, “y”]
model_param ={
“daily_seasonality”: False,
“weekly_seasonality”:False,
“yearly_seasonality”:True,
“seasonality_mode”: “multiplicative”,
“growth”: “logistic”
}
model = Prophet(**model_param)
data[‘cap’]= data[“y”].max() + data[“y”].std() * 0.05
Setting a cap or upper limit for the forecast as we are using logistics growth.
The cap will be maximum value of target variable plus 5% of std.
model.fit(data)
Create the future dataframe
future= model.make_future_dataframe(periods=365)
with the parameter periods=365 (1Y)
future[‘cap’] = data[‘cap’].max()
forecast= model.predict(future)

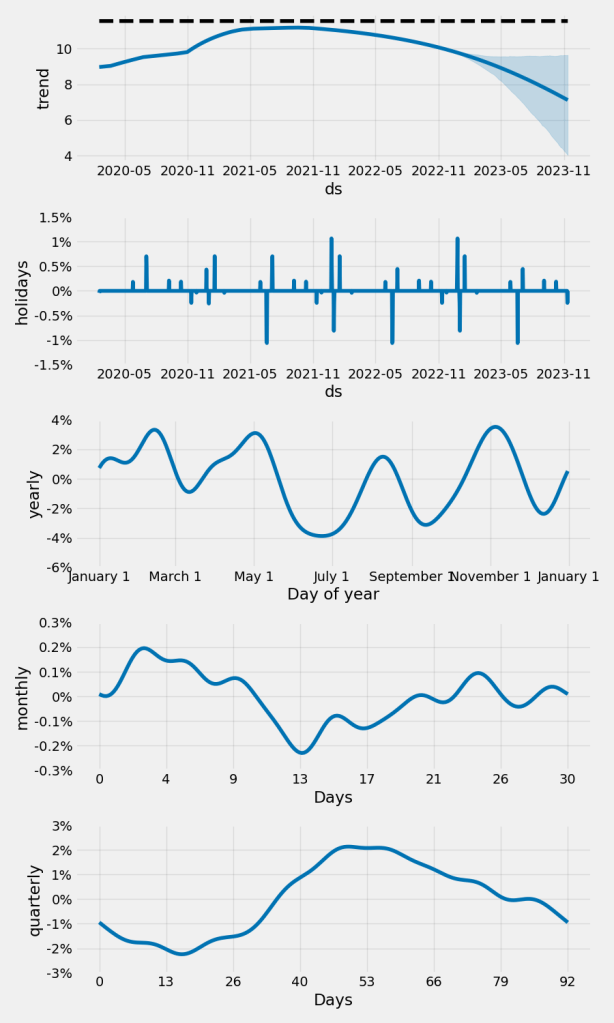
Adding parameters and seasonality and events
model = Prophet(**model_param)
model= model.add_seasonality(name=”monthly”, period=30, fourier_order=10)
model= model.add_seasonality(name=”quarterly”, period=92.25, fourier_order=10)
model.add_country_holidays(“US”)
model.fit(data)
Create th updated future dataframe
future= model.make_future_dataframe(periods=365)
future[‘cap’] = data[‘cap’].max()
forecast= model.predict(future)
forecast.head()

5 rows × 71 columns
forecast[“yhat”]=bc.untransform_boxcox(x=forecast[“yhat”], lmbda=lmbda)
forecast[“yhat_lower”]=bc.untransform_boxcox(x=forecast[“yhat_lower”], lmbda=lmbda)
forecast[“yhat_upper”]=bc.untransform_boxcox(x=forecast[“yhat_upper”], lmbda=lmbda)
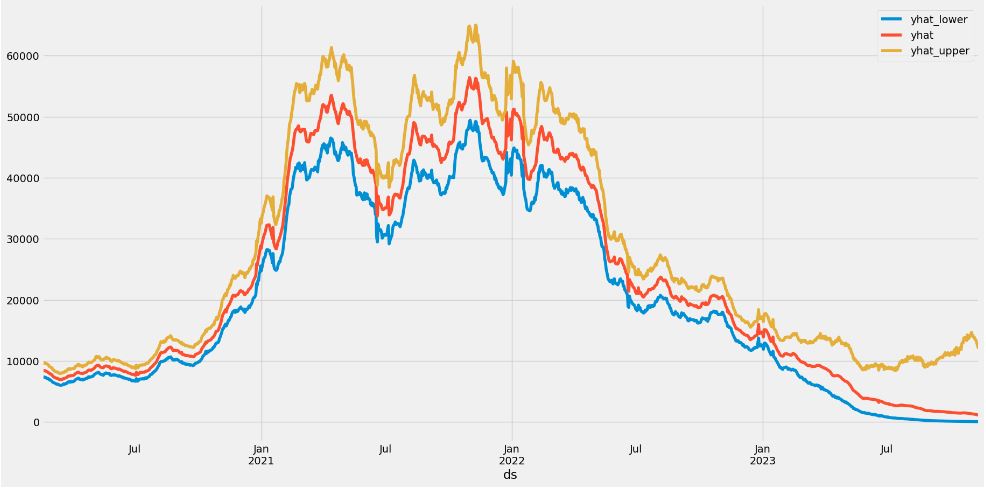
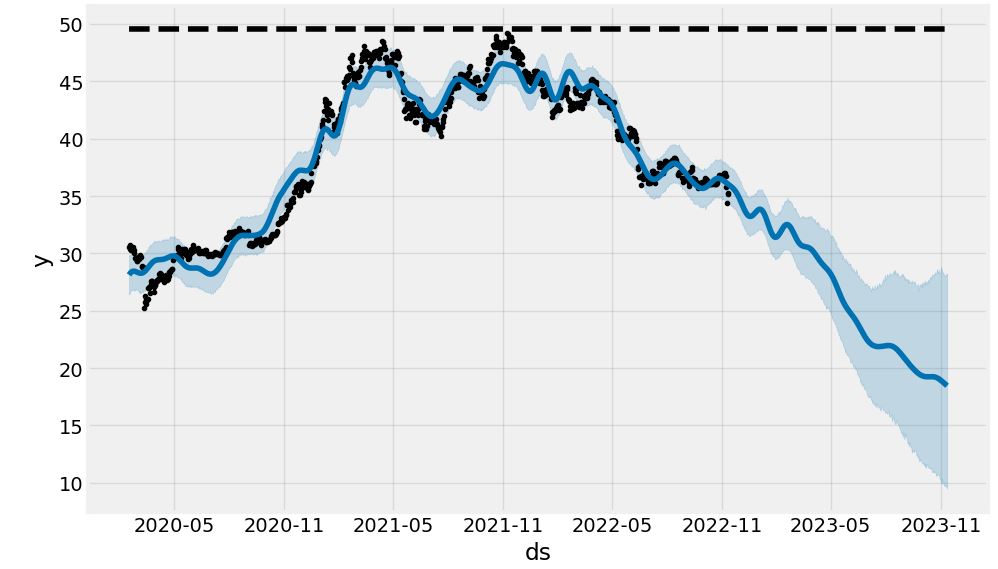
forecast.plot(x=”ds”, y=[“yhat_lower”, “yhat”, “yhat_upper”])

BTC’s price for January 2023 according to our analysis should range between $12k to $18k and the average price of ETH should be around $15k.
After the bull market peak is eventually put in, the next year in BTC-USD could be a bear market once again. If that happens, switching to shorting each bounce is the best strategy. BTC’s bear market bottom would be somewhere around levels of 2020. This is generally consistent with the Prime XBT forecast.
Disclaimer
This current BTC price prediction is done by FB Prophet. It should strictly not be taken as an investment advice. Please use your discretion and make a decision wisely.
Explore More
Why comparing cryptocurrency prices is wrong
BTC-USD Price Prediction with LSTM Keras
Zacks Investment Research Update Q4’22
Bear vs. Bull Portfolio Risk/Return Optimization QC Analysis
Towards min(Risk/Reward) – SeekingAlpha August Bear Market Update
SeekingAlpha Risk/Reward July Rundown
Bear Market Similarity Analysis using Nasdaq 100 Index Data
Stock Forecasting with FBProphet
S&P 500 Algorithmic Trading with FBProphet
Investment Risk Management Study


Make a one-time donation
Make a monthly donation
Make a yearly donation
Choose an amount
Or enter a custom amount
Your contribution is appreciated.
Your contribution is appreciated.
Your contribution is appreciated.

Leave a comment