<p class=”<a href=”https://www.bloglovin.com/blog/21501830/?claim=spnggpx7vvs”>Follow my blog with BloglovinThis post describes a Data Science (DS) roadmap, with relevant business applications.
It has been written for aspiring data scientists, technical experts who work with data scientists, data-driven technology stakeholders, or anyone interested in learning about what DS is and what it’s used for.
Why DS: The average base salary of a data scientist in the United States is $116,654 a year. Depending on their experience, skills, and location, an entry-level data scientist can earn anywhere from around $93,167 a year. A senior data scientist can earn as much as $142,144 a year.
The End-to-End (E2E) DS roadmap consists of the following three phases:
Example: The GCP Digital Transformation Funnel

Contents:
- Background
- Fundamentals
- Data Analysis
- Machine Learning
- Cross-Validation
- Cloud-Native DS APIs
- From DS to BI via ML Solutions
- Some DS/ML/BI Business Applications
- Essential DS/ML/BI E-Training
- Explore More
- Acknowledgements
- References
- More Embed Socials
- More Infographics
Background
The discipline of Data Science (DS) sits at the interface between Technology, the quantitative sciences (such as mathematics, statistics, computer science) and engineering across various business applications and sectors. This page aims to review new methods, research findings, opinions, hypothesis articles and poster presentations on all relevant aspects of DS.
As DS bridges data analytics, statistics, business intelligence (BI), artificial intelligence (AI)-powered technology and data engineering, the page is focused on applying advanced predictive analytics techniques and scientific principles to extract valuable information from data for business decision-making, strategic planning and other uses. It’s increasingly critical to businesses: The insights that data science generates help organizations increase operational efficiency, identify new business opportunities and improve marketing and sales programs, among other benefits. Ultimately, they can lead to competitive advantages over business rivals.
An effective DS team may include the following specialists: Data engineer, data analyst, Machine Learning (ML) engineer, data visualization analyst, data translator, and data architect.
The following most recent business applications drive a wide variety of DS use cases in organizations globally:
- HealthTech
- E-Commerce
- Customer experience
- Risk management
- FinTech
- Stock trading
- Digital marketing
- Industrial IoT applications
- Logistics & supply chain management
- Image/Speech Recognition
- Cybersecurity
- LegalTech
Fundamentals
- DS = Applied Math + Statistics + Computer Science
- Applied Math focuses on the acquisition of broad domain knowledge in simulation and the mathematical modelling of problems in science/engineering, in the mathematical analysis of these models and in the implementation of the results. In particular, the focus is on optimization methods, numerical linear algebra, with applications to data mining, analysis, and data modeling.
- Statistics/probability is a methodology to gain knowledge about uncertainty in all areas where empirical research and design experiments are carried out. This is linked to Descriptive, Predictive, Prescriptive, and Diagnostic Analytics.
- The discipline of Computer Science includes the study of algorithms and data structures, computer and network design, modeling data and information processes, and artificial intelligence (AI).
- Computer Science vs DS: Computer Science projects tend to entail software engineering specifically. Other tasks that could fall under the computer scientist umbrella include, but are not limited to, database administration, hardware engineering, systems analysis, network architecture, web development and a plethora of IT roles.
- Undoubtedly, any data scientist will be encouraged to study current data, find new data and solve business and product issues, all with the use of ML/AI algorithms.
- There’s a considerable relationship between industrial engineering and DS. They both require significant math skills and an analytical mindset in order to solve business problems.
- Data Engineering vs DS: Data engineers design and manage the systems and structures that collect, retrieve, and organize data, whereas data scientists analyze that data to predict patterns, gain business insights, and address questions that relate to the organization.
- Software Engineering vs DS: DS is related to gathering and processing data, whereas software engineering focuses on the development of applications and features for users. While DS includes statistics and AI, software engineering focuses more on coding languages.
- ICT vs DS: Data scientists are prepared to generate and present information, whereas information technology tends to be more focused on managing and maintaining information systems and tools.

Data Analysis
What is exploratory data analysis?
- Exploratory data analysis (EDA) is used by data scientists to analyze and investigate data sets and summarize their main characteristics, often employing data visualization methods. It helps determine how best to manipulate data sources to get the answers you need, making it easier for data scientists to discover patterns, spot anomalies, test a hypothesis, or check assumptions.
- EDA is primarily used to see what data can reveal beyond the formal modeling or hypothesis testing task and provides a provides a better understanding of data set variables and the relationships between them. It can also help determine if the statistical techniques you are considering for data analysis are appropriate.
Why is exploratory data analysis important in data science?
- The main purpose of EDA is to help look at data before making any assumptions. It can help identify obvious errors, as well as better understand patterns within the data, detect outliers or anomalous events, find interesting relations among the variables.
- Data scientists can use exploratory analysis to ensure the results they produce are valid and applicable to any desired business outcomes and goals. EDA also helps stakeholders by confirming they are asking the right questions. EDA can help answer questions about standard deviations, categorical variables, and confidence intervals. Once EDA is complete and insights are drawn, its features can then be used for more sophisticated data analysis or modeling, including machine learning.
Exploratory data analysis tools:
Specific statistical functions and techniques you can perform with EDA tools include:
- Clustering and dimension reduction techniques, which help create graphical displays of high-dimensional data containing many variables.
- Univariate visualization of each field in the raw dataset, with summary statistics.
- Bivariate visualizations and summary statistics that allow you to assess the relationship between each variable in the dataset and the target variable you’re looking at.
- Multivariate visualizations, for mapping and understanding interactions between different fields in the data.
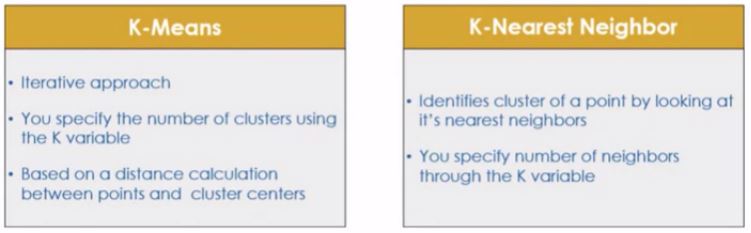
- K-means Clustering is a clustering method in unsupervised learning where data points are assigned into K groups, i.e. the number of clusters, based on the distance from each group’s centroid. The data points closest to a particular centroid will be clustered under the same category. K-means Clustering is commonly used in market segmentation, pattern recognition, and image compression.
- Predictive models, such as linear regression, use statistics and data to predict outcomes.
Two Examples:
EDA explained using sample Data set:
This is an example of white variant of Wine Quality data set which is available on UCI Machine Learning Repository.
- The describe() function in pandas is very handy in getting various summary statistics.This function returns the count, mean, standard deviation, minimum and maximum values and the quantiles of the data.
- One can find correlations using pandas “.corr()” function and can visualize the correlation matrix using a heatmap in seaborn.
- The box plot (a.k.a. box and whisker diagram) is a standardized way of displaying the distribution of data based on the five number summary:
- Minimum
- First quartile
- Median
- Third quartile
- Maximum.
Webscraping in R – IMDb ETL Showcase

Machine Learning
- ML is the science of getting computers to learn, without being explicitly programmed.
- Well-posed ML problem (Mitchell, 1998): A computer program is said to learn from experience E with respect to some task T and some performance measure P, if its performance on T, as measured by P, improves with experience E.
- There is a trade-off between ML and Data Analytics (DA)

- ML algorithms are classified into 4 types:
- Supervised
- Unsupervised Learning
- Semi-supervised Learning
- Reinforcement Learning
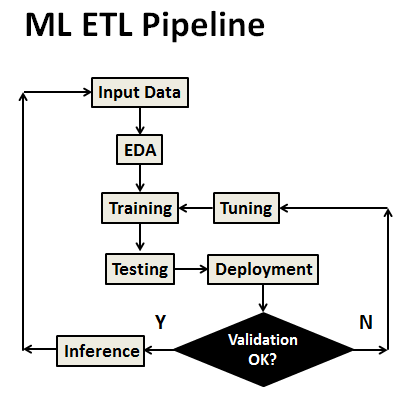
- The general E2E ETL ML pipeline is as follows
- Linear regression
- Logistic regression
- Decision tree
- SVM algorithm
- Naive Bayes algorithm
- KNN algorithm
- K-means
- Random forest algorithm
- Dimensionality reduction algorithms
- Gradient boosting algorithm and AdaBoosting algorithm
- What are the top 5 ML algorithms?

Common ML tasks are supervised/unsupervised learning
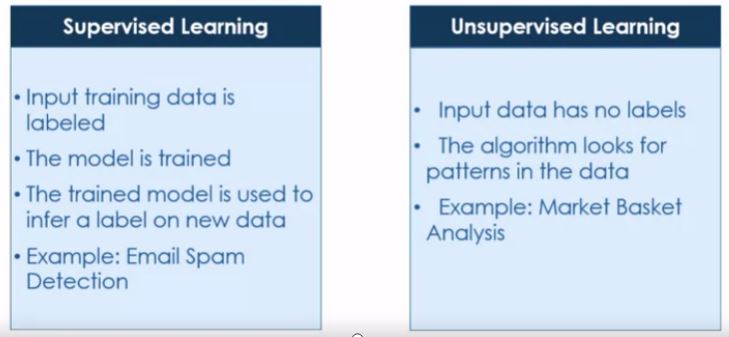
- In supervised learning, we are given a data set and already know what our correct output should look like, having the idea that there is a relationship between the input and the output.
- Supervised learning problems are categorized into “regression” and “classification” problems.
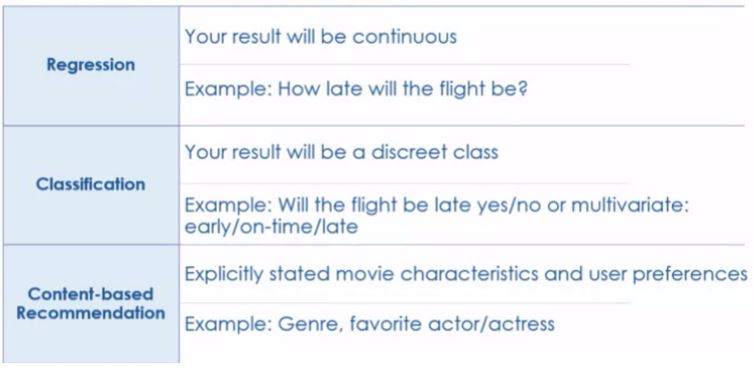
- In a regression problem, we are trying to predict results within a continuous output, meaning that we are trying to map input variables to some continuous function.
- In a classification problem, we are instead trying to predict results in a discrete output. In other words, we are trying to map input variables into discrete categories.
- The following 2 types of unsupervised ML are currently available:

- Clustering algorithms
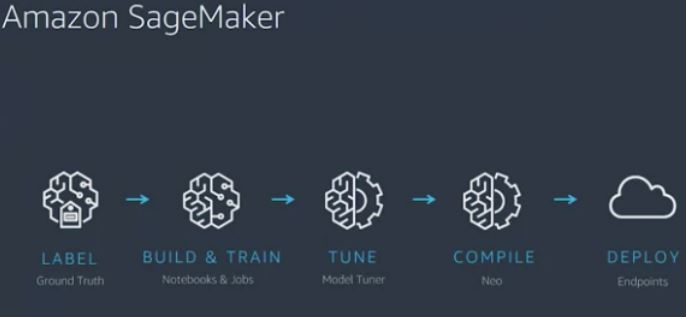
- The cutting-edge AWS ML technology is implemented as the following loop

- In the above chart, Decisions = Knowledge + Software programs
- What can ML do?
- Make predictions, optimize utility functions, extract hidden data structures, and classify data
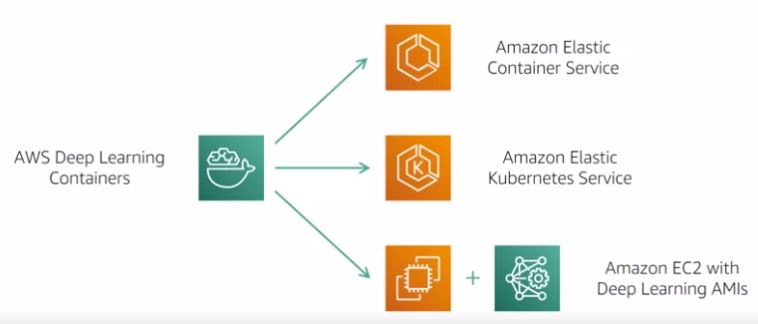
- The AWS ML flywheel of multi-domain data looks as follows
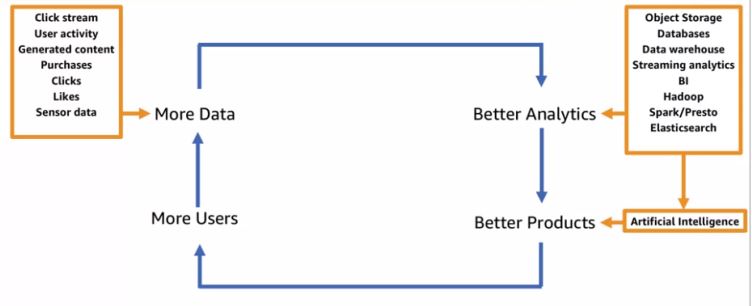
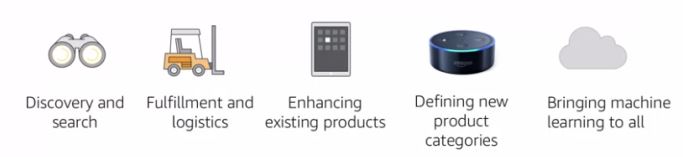
with the following AWS AI-driven services

- Key languages for developing ML solutions:

- Python scientific ecosystem:
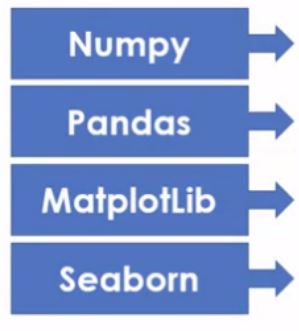
- Python libraries for ML solutions

Cross-Validation
Key ML KPIs:
Scikit-Learn cross-validation: evaluating estimator performance
- Here is a flowchart of typical cross validation workflow in model training. The best parameters can be determined by grid search techniques.
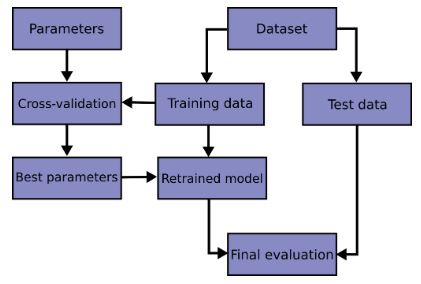
- Learning the parameters of a prediction function and testing it on the same data is a methodological mistake: a model that would just repeat the labels of the samples that it has just seen would have a perfect score but would fail to predict anything useful on yet-unseen data. This situation is called overfitting. To avoid it, it is common practice when performing a (supervised) machine learning experiment to hold out part of the available data as a test set.
- Cross validation iterators can also be used to directly perform model selection using Grid Search for the optimal hyperparameters of the model.
permutation_test_scoreoffers another way to evaluate the performance of classifiers. It provides a permutation-based p-value, which represents how likely an observed performance of the classifier would be obtained by chance. The null hypothesis in this test is that the classifier fails to leverage any statistical dependency between the features and the labels to make correct predictions on left out data.
Cloud-Native DS APIs

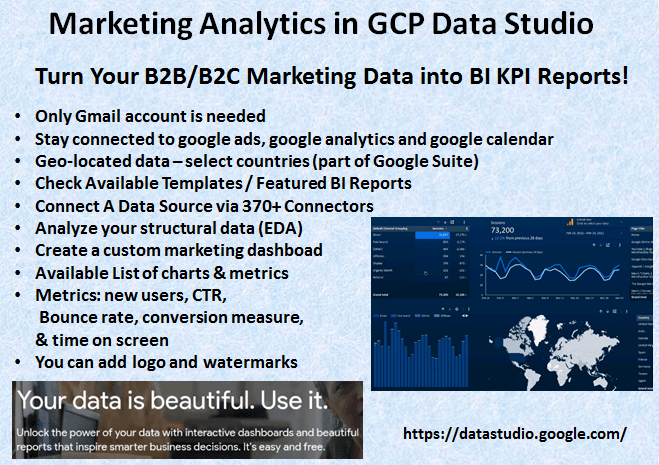
From DS to BI via ML Solutions
- BI tools vary in their functions, audiences, and design, but the end goal of each platform is somewhere in the realm of “provide users with information about their data.”
- For BI, ML can manage the heavy data lifting necessary to get to the core of your performance.
- ML is unique in that it can quickly identify relationships that may not be immediately apparent or intuitive to BI analysts.
- Though BI tools have the potential to orchestrate incredible gains, they can be incredibly inefficient.
- ML is uniquely poised to close the gap in BI tools because it can perform important analysis and adapt to different data sets.
- ML also enables BI tools to adopt more business-friendly interfaces; after all, the only ML algorithms perform the heavy data lifting.
Example: Power BI for Data Science

Some DS/ML/BI Business Applications
- HealthTech/Pharma
HPO-Tuned ML Diabetes-2 Prediction
HealthTech ML/AI Q3 ’22 Round-Up
- E-Commerce
E-Commerce Cohort Analysis in Python
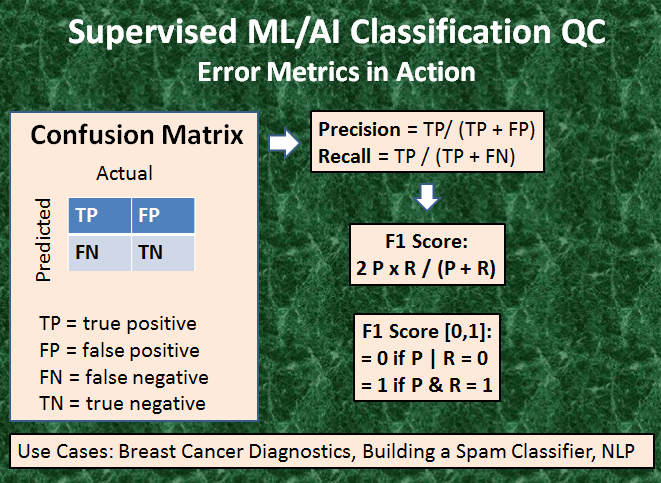
E-Commerce ML/AI Classification
E-Commerce Data Science Use-Case
Simple E-Commerce Sales BI Analytics
- Fraud Detection
Data-Driven ML Credit Card Fraud Detection
- Customer experience
Telco Customer Churn/Retention Rate ML/AI Strategies that Work!
AI-Powered Customer Churn Prediction
- Risk management
ML/AI Wildfire Prediction using Remote Sensing Data
- HR
Applications of ML/AI in HR – Predicting Employee Attrition
- Stock trading
Stock Forecasting with FBProphet
DJI Market State Analysis using the Cruz Fitting Algorithm
Macroaxis AI Investment Opportunity
Algorithmic Testing Stock Portfolios to Optimize the Risk/Reward Ratio
The Qullamaggie’s OXY Swing Breakouts
- Digital marketing
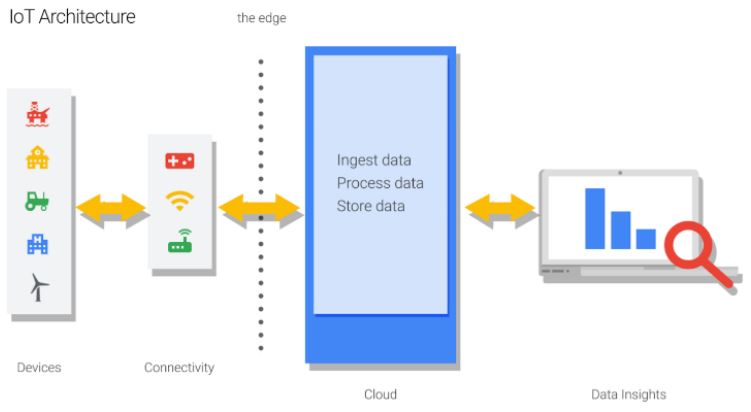
- Industrial IoT applications

- Real estate
US Real Estate – Harnessing the Power of AI
- Image/Speech Recognition
https://aws.amazon.com/rekognition/
AWS ML Blog: Text-to-Speech, Speech-to-Text and Translation services.
- Cybersecurity
Cybersecurity Summer 2022 Round-Up
Essential DS/ML/BI E-Training
Check available EdTech MOOC Training via Udemy, Coursera and edX.
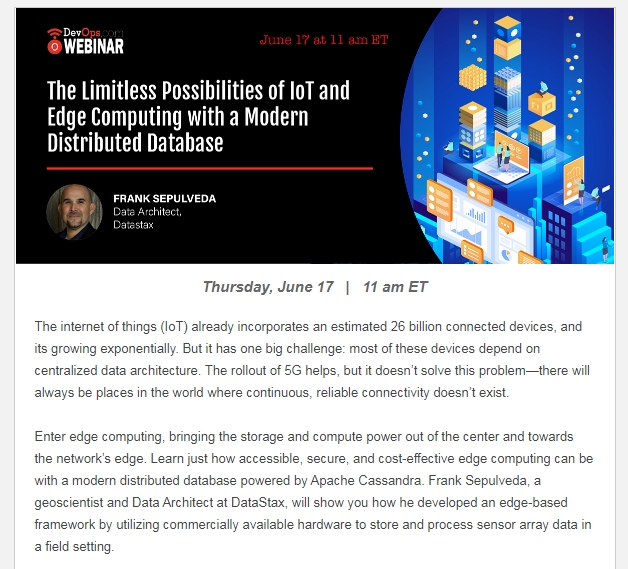
EdTech for All: Free/Paid IoT Courses ’22
Explore More
Acknowledgements
With special thanks to the Community for e-knowledge sharing and support.
References
Springer: Data Science and Engineering (DSE)
More Embed Socials
- Shared blog by Warren Miller: Answer to Is there a relation between industrial engineering and data science? @warren_k_miller
More Infographics
Cloud-Native Tech Status Update Q3 2022


LegalTech Legal analytics (LA) and Law-as-a-Service (LaaS)


Make a one-time donation
Make a monthly donation
Make a yearly donation
Choose an amount
Or enter a custom amount
Your contribution is appreciated.
Your contribution is appreciated.
Your contribution is appreciated.

Leave a comment