Tag: data science
-
Python Data Science for Real Estate & REIT Amsterdam: (Auto) EDA, NLP, Maps & ML

The Amsterdam real estate market has experienced a significant resurgence, with property prices increasing by double digits annually since 2013. Data science is being used to analyze the city’s housing and rental markets, revealing insights on the impact of Airbnb and empowering communities with the necessary information. Comprehensive data analysis and machine learning techniques are…
-
Titanic Benchmark Hypothesis Testing in Disaster Risk Management: (Auto)EDA, ML, HPO & SHAP

This project aims to apply the Titanic benchmark to hypothesis testing in disaster risk management. Using the Titanic dataset on Kaggle, a Machine Learning (ML) analysis was performed to determine the statistical significance relation between a person’s death and their passenger class, age, sex, and port of embarkation. The project involved comprehensive ML pipeline implementation…
-
Walmart Weekly Sales Time Series Forecasting using SARIMAX & ML Models

The blog post delves into Time Series Forecasting (TSF), using SARIMAX and Supervised Machine Learning algorithms to predict Walmart’s weekly store sales. Factors affecting sales are investigated for strategies to increase revenues. The study additionally covers data preparation, feature correlation analysis, SARIMAX diagnostics, and the training of supervised ML models like Linear Regression, Random Forest,…
-
Time Series Data Imputation, Interpolation & Anomaly Detection

The post compares popular time series data imputation, interpolation, and anomaly detection methods. It explores the challenges of missing data and the impact on processing, analyzing, and model accuracy. The study performs data-centric experiments to benchmark optimal methods and highlights the importance of imputation for time series forecasting. It provides practical strategies and techniques for…
-
Uber’s Orbit Full Bayesian Time Series Forecasting & Inference

This article introduces Orbit, an open-source Python framework by Uber for full Bayesian time series forecasting and inference. It supports models like Exponential Smoothing, Local Global Trend, and Kernel Time-based Regression, along with methods like Markov-Chain Monte Carlo and Variational Inference. Orbit captures uncertainty in time-series data, allowing credible probabilistic forecasts with confidence intervals. The…
-
Kalman-Based Object Tracking with Low Signal/Noise Ratio

This study focuses on real-time object tracking with low signal/noise ratios using Kalman Filter (KF) algorithms. The study covers 1D, 2D, and 3D motion analysis, and explores the impact of noise on the accuracy of object tracking. The accuracy of the KF algorithms in estimating the object’s position and speed in real-time scenarios is evaluated…
-
MLflow SHAP & Transformers

The post covers simplified MLflow projects for reproducible and reusable data science code. It details local environment setup, ElasticNet model optimization, and SHAP explanations for breast cancer, diabetes, and iris datasets. Additionally, it showcases MLflow Sentence Transformers for a chatbot and translation. This demonstrates their powerful interface for managing transformer models from libraries like Hugging…
-
Sensitivity of Kalman Object Tracking to Noise & State Errors

Featured Foto by AtHul K Anand on Pexels Table of Contents Constant Voltage Alternating Current Linear Trend Path Non-Linear Trend Path Velocity Modeling Acceleration Modeling Circular Motion Robot 2D Location Tracking Notations: (dX, dY) = (XY) position error, (dVx, dVy) = (XY) velocity vector error, e.g. 3D Location Tracking Summary Explore More References
-
100 Basic Python Codes
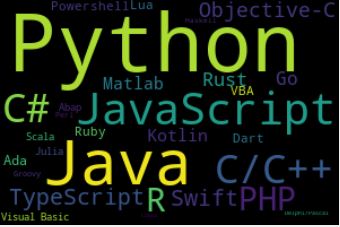
Source: PYPL Popularity of Programming Language, Feb 2024. Table of Contents Setting Up Your Environment Download Datasets Initial Pandas Data QC Displaying Pandas Data Types Showing Descriptive Statistics Exploring the Dataset Email Slicer User Input & Type Conversion Working with Lists Practicing Loops Calculator Temperature Conversion ADC Temperature Sensor Sorting Numpy Arrays Story Generator Display…
-
Malware Detection & Interpretation – PCA, T-SNE & ML

This post discusses the application of PCA, T-SNE, and supervised ML algorithms for malware detection using a benchmark dataset. Techniques such as Logistic Regression, SVC, KNN, and XGBoost are implemented, achieving high performance metrics. Results show potential for improving malware detection using ML while reducing false positives and enhancing cyber defense.
-
Retail Sales, Store Item Demand Time-Series Analysis/Forecasting: AutoEDA, FB Prophet, SARIMAX & Model Tuning

This study compares and evaluates various forecasting models to predict sales and demand for retail businesses. The focus is on Time Series Analysis (TSA) methods such as FB Prophet and SARIMAX. The final FB Prophet model yields MAE=4.252 and MAPE=0.168, while SARIMAX models’ best performing variant achieves MAE=6.285 and MAPE=0.213. The study emphasizes the importance…
-
H2O AutoML Malware Detection

This study explores AI-powered malware detection using the H2O AutoML algorithm for effective and rapid classification of PE files. The optimized Stacked Ensemble model achieved high precision, recall, and F1 score. The research validates the H2O AutoML workflow’s accurate malware identification and supports related R&D products and solutions in the field of information security.
-
Kalman-Based Target Trajectory Tracking Performance QC Analysis

Photo by Kelly on Pexels. Table of Contents The Kalman Filter Intuition Formulation of a Problem Linear Position-Time Path Parabolic Position-Time Path Extended Kalman Filter (EKF) Tracking the Bike’s Path Unscented Kalman Filter (UKF) 1. Prediction Step 2. Correction Step Industry Application in Dynamic Positioning System Smoothed Position and Speed Estimates Radar EKF Trajectory Conclusions…
-
Anatomy of the Robust 1D Kalman Filter

The Kalman Filter (KF) is a powerful tool for tracking, navigation, and data prediction tasks. It is based on the assumption of linearity and Gaussian noise, enabling it to iteratively update predicted models. The article outlines a simplified implementation of KF using Python commands, with examples demonstrating its effectiveness in handling noisy measurements. It also…
-
Basic Python Programming

This guide introduces basic concepts and features of the Python programming language. It covers a range of topics, including installation, variables, strings, lists, tuples, sets, dictionaries, loops, conditionals, functions, and modules. The comprehensive content provides valuable information for beginners seeking to learn Python for data science or general programming.
-
Leveraging Predictive Uncertainties of Time Series Forecasting Models

Featured Image via Canva. Table of Contents Introduction Random Simulation Tests TSLA Stock 43 Days TSLA Stock 300 Days Housing in the United States Industrial Production Federal Funds Rate Data S&P 500 Absolute Returns Number of Airline Passengers- 1. Holt-Winters Number of Airline Passengers- 2. Prophet Average Temperature in India Monthly Sales Data Analysis QC…
-
A Market-Neutral Strategy

The work aims to solve the problem of Markowitz portfolio optimization for a one-year investment horizon through the pairs trading cointegrated strategy. Market-neutral trading strategies seek to generate returns independent of market swings to achieve a zero beta against its relevant market index. Statistical arbitrage (SA), pairs trading, and APO signals are analyzed. The study…
-
A Comprehensive Analysis of Best Trading Technical Indicators w/ TA-Lib – Tesla ’23

This study presents a comprehensive stock technical analysis guide for Tesla (TSLA) using the TA-Lib Python library. It explores the use of over 200 technical indicators, analyses historical data, and offers insight for both swing traders and long-term holders. The content includes detailed explanations and plots for various momentum, volume, volatility, and trend indicators, providing…
-
Real-Time Stock Sentiment Analysis w/ NLP Web Scraping

Stock sentiment analysis is gaining popularity as a technique to understand public opinions on specific assets. This study uses NLP web scraping in Python to extract stock sentiments from financial news headlines on FinViz. The sentiment analysis can help determine investor opinions and potential impacts on stock prices, though it is not a standalone predictor.
-
Sales Forecasting: tslearn, Random Walk, Holt-Winters, SARIMAX, GARCH, Prophet, and LSTM
The data science project involves evaluating various sales forecasting algorithms in Python using a Kaggle time-series dataset. The forecasting algorithms include tslearn, Random Walk, Holt-Winters, SARIMA, GARCH, Prophet, LSTM and Di Pietro’s Model. The goal is to predict next month’s sales for a list of shops and products, which slightly changes every month. The best…
