
Featured Photo by Johannes Plenio on Pexels.
Today we will discuss the XOM stock using most basic technical trading indicators (TTIs) within the Python library ta-lib. Recall that this library is widely used by algo traders requiring to perform technical analysis of financial market data. It includes 150+ indicators such as ADX, MACD, RSI, Stochastic, Bollinger Bands, etc., Candlestick pattern recognition, and open-source API for C/C++, Java, Perl, Python and 100% Managed .NET.
Following the recent DDIntel post, we will restrict ourselves to the most common trend indicators such as the Simple Moving Averages (SMA) and the Exponential Moving Average (EMA). Also, we will compute the Relative Strength Indicator (RSI). This is the most popular momentum indicator. It measures the speed and magnitude of a security’s recent price changes to evaluate overvalued or undervalued conditions in the price of that security.
Contents:
- SeekingAlpha Advice
- Key Libraries
- Stock Data
- SMA
- EMA
- SMA vs EMA
- RSI Indicator
- Summary
- Explore More
- Embed Socials
- Appendix: XOM Fundamentals
SeekingAlpha Advice
Key Libraries
Let’s install ta-lib within the Anaconda IDE as follows
conda install -c conda-forge ta-lib
We can now open our Jupyter notebook and start scripting.
Let’s set the working directory YOURPATH
import os
os.chdir(‘YOURPATH’)
os. getcwd()
and import the key libraries
import talib
import pandas as pd
import plotly.graph_objects as go
from plotly.subplots import make_subplots
import yfinance as yf
Stock Data
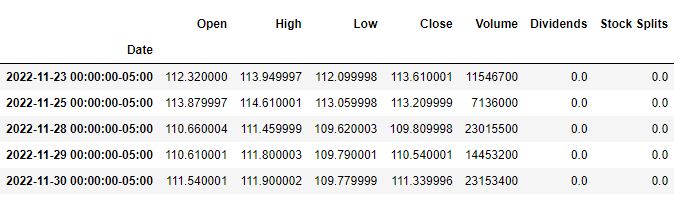
We are ready to import the XOM stock data from yfinance
stock_data = yf.download(“XOM”, start=”2020-01-01″, end=”2022-12-01″)
stock_data.tail()
[*********************100%***********************] 1 of 1 completed

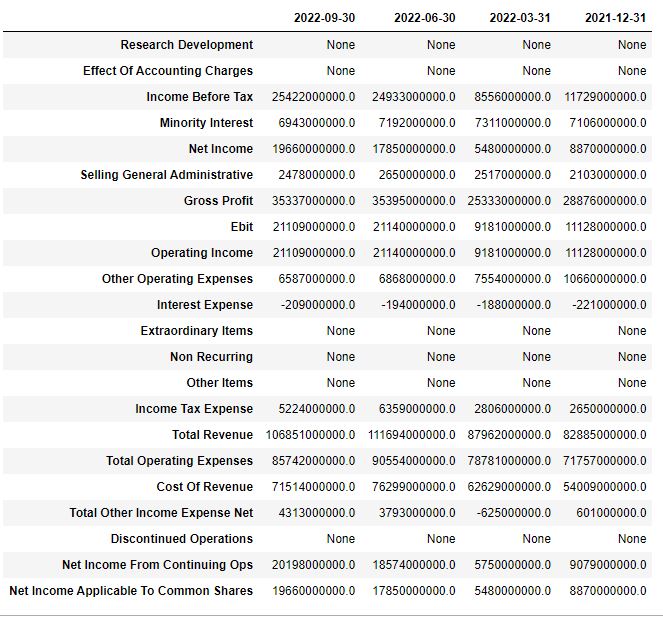
We can examine the XOM fundamentals in Appendix.
SMA
- SMA is simply the mean, or average, of the stock price values over the specified period.
- Averaging out the prices creates a smoothing effect, which clarifies the price’s direction — upward, downward, or sideways. Moving averages based on a longer lookback period have a better smoothing effect compared to those with shorter ones.
Let’s calculate the following two SMAs
stock_data[“SMA_short”] = talib.SMA(stock_data[“Close”], timeperiod=10)
stock_data[“SMA_long”] = talib.SMA(stock_data[“Close”], timeperiod=50)
and create their line plots
fig = go.Figure(data=[go.Scatter(
name=”Close”,
x=stock_data.index,
y=stock_data[“Close”],
mode=’lines’),
go.Scatter(name=”SMA_short”, x=stock_data.index, y=stock_data[‘SMA_short’], line=dict(color=’green’, width=2.5)),
go.Scatter(name=”SMA_long”, x=stock_data.index, y=stock_data[‘SMA_long’], line=dict(color=’red’, width=2.5))])
Add title
fig.update_layout(title=’XOM Prices’)
Edit axis labels
fig[‘layout’][‘yaxis’][‘title’]=’Price’
fig.show()

- If the SMA is moving up, the trend is up. If the SMA is moving down, the trend is down. Shorter/longer period SMAs can be used to determine shorter/longer term trends.
- Price crossing SMA is often used to trigger trading signals. When prices cross above the SMA, you might want to go long or cover short; when they cross below the SMA, you might want to go short or exit long.
- SMA Crossing SMA is another common trading signal. When a short period SMA crosses above a long period SMA, you may want to go long. You may want to go short when the short-term SMA crosses back below the long-term SMA.
EMA
An even more effective way of producing trading signals is with a double exponential moving average strategy, using one short-term and one-long term EMA. This exponential moving average strategy creates a trading signal when the shorter EMA indicator crosses the longer one.
As with SMAs, we can calculate the following two EMAs
stock_data[“EMA_short”] = talib.EMA(stock_data[“Close”], timeperiod=10)
stock_data[“EMA_long”] = talib.EMA(stock_data[“Close”], timeperiod=50)
and create the plot
fig = go.Figure(data=[go.Scatter(
name=”Close”,
x=stock_data.index,
y=stock_data[“Close”],
mode=’lines’),
go.Scatter(name=”EMA_short”, x=stock_data.index, y=stock_data[‘EMA_short’], line=dict(color=’green’, width=2.5)),
go.Scatter(name=”EMA_long”, x=stock_data.index, y=stock_data[‘EMA_long’], line=dict(color=’red’, width=2.5))])
Customise and show the plot
fig.update_layout(title=’XOM Prices’)
fig[‘layout’][‘yaxis’][‘title’]=’Price’
fig.show()
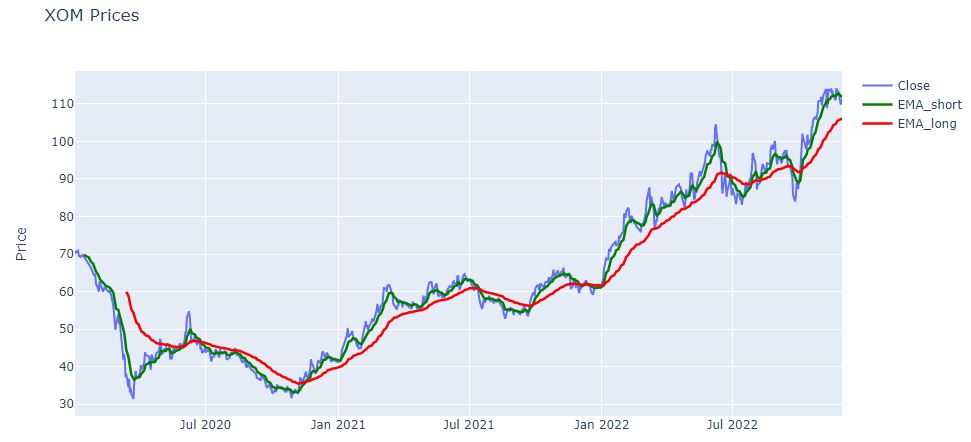
With this EMA crossover strategy, the trader would buy when the short-term EMA crosses above the long-term EMA, and sell when the short-term EMA crosses below the long-term EMA.
SMA vs EMA
Let’s calculate both the SMA and EMA indicators with the same lookback period, and plot them together.
Calculate the SMA
stock_data[‘SMA’] = talib.SMA(stock_data[‘Close’], timeperiod=50)
Calculate the EMA
stock_data[‘EMA’] = talib.EMA(stock_data[‘Close’], timeperiod=50)
Plot the SMA, EMA with prices
fig = go.Figure(data=[go.Scatter(
name=”Close”,
x=stock_data.index,
y=stock_data[“Close”],
mode=’lines’),
go.Scatter(name=”SMA”, x=stock_data.index, y=stock_data[‘SMA’], line=dict(color=’orange’, width=2.5)),
go.Scatter(name=”EMA”, x=stock_data.index, y=stock_data[‘EMA’], line=dict(color=’green’, width=2.5))])
Customise and show the plot
fig.update_layout(title=’XOM Prices’)
fig[‘layout’][‘yaxis’][‘title’]=’Price’
fig.show()

- It is clear that EMA is more sensitive to price movement turning up before SMA.
- Both moving averages use previous price data, so they lag behind current trends. For this reason, they are often used alongside other technical indicators, underpinning them to provide a more in-depth analysis. The data sets that are used to form the average are continuously replaced by new data, which is why it’s called a moving average.
- Due to the way they’re calculated, EMA give more weighting to recent prices, which can potentially make them more relevant. Traders with a short-term perspective will usually get similar results with whichever average they use, whereas traders with a long-term perspective need to carefully determine what they need their indicators to show them. There will be a distinct difference between SMA and EMA over a longer time period.
RSI Indicator
Let’s invoke the RSI formula and create the RSI momentum indicator curve with horizontal lines at 30 and 70
Calculate RSI
stock_data[‘RSI’] = talib.RSI(stock_data[‘Close’])
Create subplots
fig = make_subplots(rows=2, cols=1,
subplot_titles=[
“Close Price”, “Momentum Indicator RSI”])
Make subplot of prices
fig.add_trace(
go.Scatter(
name=”Close”,
x = stock_data.index,
y=stock_data[“Close”]
),
row=1, col=1
)
Make subplot of RSI
fig.add_trace(
go.Scatter(
name=”RSI”,
x= stock_data.index,
y=stock_data[“RSI”]
),
row=2, col=1
)
Customise and show plot
fig[‘layout’][‘yaxis’][‘title’]=’Price’
fig[‘layout’][‘yaxis2’][‘title’]=’RSI’
fig.update_layout(height=600, title_text=”XOM Data”)
fig[‘layout’].update(shapes=[{‘type’: ‘line’,’y0′:70,’y1′: 70,’x0′:str(stock_data.index[0]),
‘x1′:str(stock_data.index[-1]),’xref’:’x2′,’yref’:’y2′,
‘line’: {‘color’: ‘green’,’width’: 2.5}},
{‘type’: ‘line’,’y0′:30,’y1′: 30,’x0′:str(stock_data.index[0]),
‘x1′:str(stock_data.index[-1]),’xref’:’x2′,’yref’:’y2′,
‘line’: {‘color’: ‘green’,’width’: 2.5}}]) # Adds horizontal lines
fig.show()

- The way W. Wilder recommends using the RSI is by using the 30 and 70 levels in the oscillator as oversold and overbought levels respectively. This means that when RSI falls below 30, you aim to buy the financial security that has been sold too much and when the RSI reaches over 70, you aim to sell the financial asset that has been bought too much.
- Traditionally, an RSI over 70 indicates the security is overbought and overvalued, which means the price may reverse. Likewise, an RSI below 30 means the asset is oversold and undervalued and the price may rally from hereon.
- The RSI is one of the most popular indicators for forex traders, cryptocurrency traders, stock traders and futures traders.
Summary
- XOM is being the “belle of the ball” for investors at present.
- It’s having trouble breaking through the $110 level.
- The stock has pretty much reached the top end of their estimates.
- XOM’s stock will be falling ~20% in the near term.
- In the first half of 2023, XOM might be dropping back into the $90 buy range.
- Our observations are consistent with the SeekingAlpha advice mentioned above.
Explore More
Energy E&P: XOM Technical Analysis Nov ’22
The Zacks’s Market Outlook Nov ’22 – Energy Focus
Embed Socials
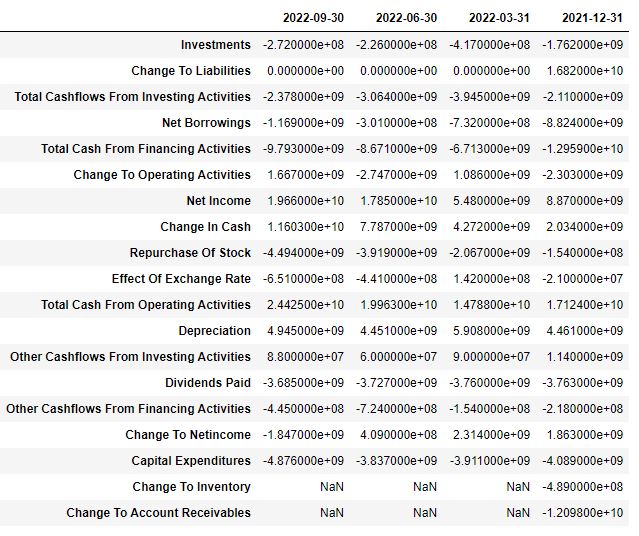
Appendix: XOM Fundamentals
Let’s look at the XOM stock fundamentals
import yfinance as yf
xom = yf.Ticker(“XOM”)
get stock info
xom.info
{'zip': '75039-2298',
 'sector': 'Energy',
 'fullTimeEmployees': 63000,
 'longBusinessSummary': 'Exxon Mobil Corporation explores for and produces crude oil and natural gas in the United States and internationally. It operates through Upstream, Downstream, and Chemical segments. The company is also involved in the manufacture, trade, transport, and sale of crude oil, natural gas, petroleum products, petrochemicals, and other specialty products; manufactures and sells petrochemicals, including olefins, polyolefins, aromatics, and various other petrochemicals; and captures and stores carbon, hydrogen, and biofuels. As of December 31, 2021, it had approximately 20,528 net operated wells with proved reserves. The company was founded in 1870 and is headquartered in Irving, Texas.',
 'city': 'Irving',
 'phone': '972-940-6000',
 'state': 'TX',
 'country': 'United States',
 'companyOfficers': [],
 'website': 'https://corporate.exxonmobil.com',
 'maxAge': 1,
 'address1': '5959 Las Colinas Boulevard',
 'industry': 'Oil & Gas Integrated',
 'ebitdaMargins': 0.21141,
 'profitMargins': 0.13317999,
 'grossMargins': 0.32086,
 'operatingCashflow': 76300001280,
 'revenueGrowth': 0.482,
 'operatingMargins': 0.16066,
 'ebitda': 82322997248,
 'targetLowPrice': 77,
 'recommendationKey': 'buy',
 'grossProfits': 90045000000,
 'freeCashflow': 43145248768,
 'targetMedianPrice': 120,
 'currentPrice': 110.67,
 'earningsGrowth': 1.981,
 'currentRatio': 1.341,
 'returnOnAssets': 0.11063,
 'numberOfAnalystOpinions': 25,
 'targetMeanPrice': 117.46,
 'debtToEquity': 23.532,
 'returnOnEquity': 0.29733,
 'targetHighPrice': 138,
 'totalCash': 30407000064,
 'totalDebt': 45427998720,
 'totalRevenue': 389392007168,
 'totalCashPerShare': 7.383,
 'financialCurrency': 'USD',
 'revenuePerShare': 91.859,
 'quickRatio': 0.983,
 'recommendationMean': 2.3,
 'exchange': 'NYQ',
 'shortName': 'Exxon Mobil Corporation',
 'longName': 'Exxon Mobil Corporation',
 'exchangeTimezoneName': 'America/New_York',
 'exchangeTimezoneShortName': 'EST',
 'isEsgPopulated': False,
 'gmtOffSetMilliseconds': '-18000000',
 'quoteType': 'EQUITY',
 'symbol': 'XOM',
 'messageBoardId': 'finmb_406338',
 'market': 'us_market',
 'annualHoldingsTurnover': None,
 'enterpriseToRevenue': 1.226,
 'beta3Year': None,
 'enterpriseToEbitda': 5.797,
 '52WeekChange': 0.816906,
 'morningStarRiskRating': None,
 'forwardEps': 11.38,
 'revenueQuarterlyGrowth': None,
 'sharesOutstanding': 4118289920,
 'fundInceptionDate': None,
 'annualReportExpenseRatio': None,
 'totalAssets': None,
 'bookValue': 45.189,
 'sharesShort': 41236390,
 'sharesPercentSharesOut': 0.01,
 'fundFamily': None,
 'lastFiscalYearEnd': 1640908800,
 'heldPercentInstitutions': 0.598,
 'netIncomeToCommon': 51860000768,
 'trailingEps': 12.25,
 'lastDividendValue': 0.91,
 'SandP52WeekChange': -0.10858184,
 'priceToBook': 2.4490473,
 'heldPercentInsiders': 0.0007,
 'nextFiscalYearEnd': 1703980800,
 'yield': None,
 'mostRecentQuarter': 1664496000,
 'shortRatio': 2.15,
 'sharesShortPreviousMonthDate': 1665705600,
 'floatShares': 4112198347,
 'beta': 1.129488,
 'enterpriseValue': 477200154624,
 'priceHint': 2,
 'threeYearAverageReturn': None,
 'lastSplitDate': 995500800,
 'lastSplitFactor': '2:1',
 'legalType': None,
 'lastDividendDate': 1668384000,
 'morningStarOverallRating': None,
 'earningsQuarterlyGrowth': 1.913,
 'priceToSalesTrailing12Months': 1.1704686,
 'dateShortInterest': 1668470400,
 'pegRatio': 0.31,
 'ytdReturn': None,
 'forwardPE': 9.724956,
 'lastCapGain': None,
 'shortPercentOfFloat': 0.01,
 'sharesShortPriorMonth': 41541776,
 'impliedSharesOutstanding': 0,
 'category': None,
 'fiveYearAverageReturn': None,
 'previousClose': 111.34,
 'regularMarketOpen': 111.64,
 'twoHundredDayAverage': 92.65395,
 'trailingAnnualDividendYield': 0.031614874,
 'payoutRatio': 0.2873,
 'volume24Hr': None,
 'regularMarketDayHigh': 112.07,
 'navPrice': None,
 'averageDailyVolume10Day': 15942080,
 'regularMarketPreviousClose': 111.34,
 'fiftyDayAverage': 104.1276,
 'trailingAnnualDividendRate': 3.52,
 'open': 111.64,
 'toCurrency': None,
 'averageVolume10days': 15942080,
 'expireDate': None,
 'algorithm': None,
 'dividendRate': 3.64,
 'exDividendDate': 1668384000,
 'circulatingSupply': None,
 'startDate': None,
 'regularMarketDayLow': 110.18,
 'currency': 'USD',
 'trailingPE': 9.034286,
 'regularMarketVolume': 5617104,
 'lastMarket': None,
 'maxSupply': None,
 'openInterest': None,
 'marketCap': 455771127808,
 'volumeAllCurrencies': None,
 'strikePrice': None,
 'averageVolume': 19267972,
 'dayLow': 110.18,
 'ask': 110.5,
 'askSize': 1000,
 'volume': 5617104,
 'fiftyTwoWeekHigh': 114.66,
 'fromCurrency': None,
 'fiveYearAvgDividendYield': 5.38,
 'fiftyTwoWeekLow': 57.96,
 'bid': 110.49,
 'tradeable': False,
 'dividendYield': 0.033099998,
 'bidSize': 800,
 'dayHigh': 112.07,
 'coinMarketCapLink': None,
 'regularMarketPrice': 110.67,
 'preMarketPrice': 111.38,
 'logo_url': 'https://logo.clearbit.com/corporate.exxonmobil.com'}
get historical market data
hist = xom.history(period=”max”)
hist.tail()
Show actions (dividends, splits)
xom.actions

Show financials
xom.financials
xom.quarterly_financials
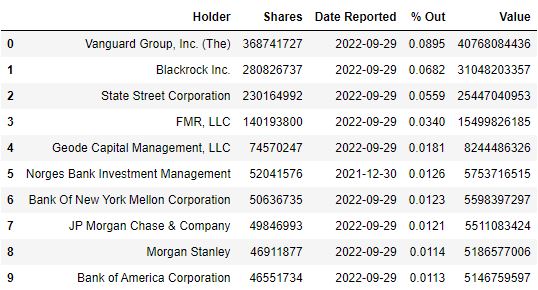
Show major holders
xom.major_holders

show institutional holders
xom.institutional_holders
show the balance sheet
xom.balance_sheet
xom.quarterly_balance_sheet

show cashflow
xom.cashflow
xom.quarterly_cashflow
show earnings
xom.earnings
xom.quarterly_earnings

show sustainability (ESG)
xom.sustainability

show analysts recommendations
xom.recommendations

show next event (earnings, etc)
xom.calendar
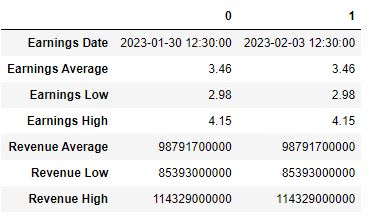
show all earnings dates
xom.earnings_dates

show ISIN code – experimental
ISIN = International Securities Identification Number
xom.isin
'-'
show options expirations
xom.options
('2022-12-02',
 '2022-12-09',
 '2022-12-16',
 '2022-12-23',
 '2022-12-30',
 '2023-01-06',
 '2023-01-20',
 '2023-02-17',
 '2023-03-17',
 '2023-04-21',
 '2023-06-16',
 '2023-07-21',
 '2024-01-19',
 '2024-06-21',
 '2025-01-17',
 '2026-02-21')
show news
xom.news
[{'uuid': '4dfd85df-1b31-3a0c-8257-b615f57d9ecd',
  'title': 'CVX to Commence Venezuelan Oil Output Amid Easing Sanctions',
  'publisher': 'Zacks',
  'link': 'https://finance.yahoo.com/news/cvx-commence-venezuelan-oil-output-131701890.html',
  'providerPublishTime': 1669900621,
  'type': 'STORY',
  'thumbnail': {'resolutions': [{'url': 'https://s.yimg.com/uu/api/res/1.2/TmzzsvOnawwhgOwaB_xKTw--~B/aD00MDA7dz02MzU7YXBwaWQ9eXRhY2h5b24-/https://media.zenfs.com/en/zacks.com/6b283354cdabb079603e8ccc6e86b556',
     'width': 635,
     'height': 400,
     'tag': 'original'},
    {'url': 'https://s.yimg.com/uu/api/res/1.2/L5y1WN2SX04iC4Fku2ctKA--~B/Zmk9ZmlsbDtoPTE0MDtweW9mZj0wO3c9MTQwO2FwcGlkPXl0YWNoeW9u/https://media.zenfs.com/en/zacks.com/6b283354cdabb079603e8ccc6e86b556',
     'width': 140,
     'height': 140,
     'tag': '140x140'}]},
  'relatedTickers': ['CVX', 'VLO', 'PSX', 'XOM']},
 {'uuid': '38693702-8602-3097-80ac-4c6e4da44eb0',
  'title': 'BofA warns hot inflation might run rampant for another 10 years — here’s the 1 shockproof sector that could preserve your wealth under that worst-case scenario',
  'publisher': 'MoneyWise',
  'link': 'https://finance.yahoo.com/news/bofa-warns-hot-inflation-might-160000338.html',
  'providerPublishTime': 1669896000,
  'type': 'STORY',
  'thumbnail': {'resolutions': [{'url': 'https://s.yimg.com/uu/api/res/1.2/Dpwmkynnju1yWpCrJW0s5Q--~B/aD00MDA7dz03Mjg7YXBwaWQ9eXRhY2h5b24-/https://media.zenfs.com/en/moneywise_327/4b1b0a3cef8079f92c5de821105bd124',
     'width': 728,
     'height': 400,
     'tag': 'original'},
    {'url': 'https://s.yimg.com/uu/api/res/1.2/J.hXoAYnTLRGs7OrCq6sNg--~B/Zmk9ZmlsbDtoPTE0MDtweW9mZj0wO3c9MTQwO2FwcGlkPXl0YWNoeW9u/https://media.zenfs.com/en/moneywise_327/4b1b0a3cef8079f92c5de821105bd124',
     'width': 140,
     'height': 140,
     'tag': '140x140'}]},
  'relatedTickers': ['XOM', 'COP']},
 {'uuid': '5e662628-041f-301f-8b45-93cfa5da31f1',
  'title': 'ExxonMobil and Mitsubishi Heavy Industries partner to advance carbon capture technology',
  'publisher': 'American City Business Journals',
  'link': 'https://finance.yahoo.com/m/5e662628-041f-301f-8b45-93cfa5da31f1/exxonmobil-and-mitsubishi.html',
  'providerPublishTime': 1669837223,
  'type': 'STORY',
  'thumbnail': {'resolutions': [{'url': 'https://s.yimg.com/uu/api/res/1.2/Ngh85rKDp2uNvvJOPZEg.Q--~B/aD05NjA7dz0xNDQwO2FwcGlkPXl0YWNoeW9u/https://media.zenfs.com/en/bizjournals.com/7c4117b5de6c0c8da7136e56c17d368e',
     'width': 1440,
     'height': 960,
     'tag': 'original'},
    {'url': 'https://s.yimg.com/uu/api/res/1.2/uxqxlP.R2J0dbfrYaPKh8w--~B/Zmk9ZmlsbDtoPTE0MDtweW9mZj0wO3c9MTQwO2FwcGlkPXl0YWNoeW9u/https://media.zenfs.com/en/bizjournals.com/7c4117b5de6c0c8da7136e56c17d368e',
     'width': 140,
     'height': 140,
     'tag': '140x140'}]},
  'relatedTickers': ['XOM']},
 {'uuid': 'ad4ceaf5-851c-3541-8b61-3590fe16eb43',
  'title': 'Top 10 Stocks to Buy in 10 Different Sectors',
  'publisher': 'Insider Monkey',
  'link': 'https://finance.yahoo.com/news/top-10-stocks-buy-10-185419433.html',
  'providerPublishTime': 1669834459,
  'type': 'STORY',
  'thumbnail': {'resolutions': [{'url': 'https://s.yimg.com/uu/api/res/1.2/4r3VkLTbSdmy_lkn6bN3eg--~B/aD0yNjY7dz00MDA7YXBwaWQ9eXRhY2h5b24-/https://media.zenfs.com/en/insidermonkey.com/d279f357cb7ade87d189354aa129af07',
     'width': 400,
     'height': 266,
     'tag': 'original'},
    {'url': 'https://s.yimg.com/uu/api/res/1.2/biLujmcga95Ex1gwU2JbjQ--~B/Zmk9ZmlsbDtoPTE0MDtweW9mZj0wO3c9MTQwO2FwcGlkPXl0YWNoeW9u/https://media.zenfs.com/en/insidermonkey.com/d279f357cb7ade87d189354aa129af07',
     'width': 140,
     'height': 140,
     'tag': '140x140'}]},
  'relatedTickers': ['DUK', 'LMT', 'CCI', 'GOOGL', 'WMT', 'XOM']},
 {'uuid': 'ef4b8b79-1482-389c-9760-a116a4f30fe7',
  'title': '11 Best Nuclear Energy Stocks To Buy Today',
  'publisher': 'Insider Monkey',
  'link': 'https://finance.yahoo.com/news/11-best-nuclear-energy-stocks-183736918.html',
  'providerPublishTime': 1669833456,
  'type': 'STORY',
  'thumbnail': {'resolutions': [{'url': 'https://s.yimg.com/uu/api/res/1.2/X759wytYF0BqNvn4JBVIUw--~B/aD01MDk7dz03Njg7YXBwaWQ9eXRhY2h5b24-/https://media.zenfs.com/en/insidermonkey.com/80e5390fb090b46f6fc4addf28b56d3a',
     'width': 768,
     'height': 509,
     'tag': 'original'},
    {'url': 'https://s.yimg.com/uu/api/res/1.2/kVfiNiyI3npU.Ou7WK4lEA--~B/Zmk9ZmlsbDtoPTE0MDtweW9mZj0wO3c9MTQwO2FwcGlkPXl0YWNoeW9u/https://media.zenfs.com/en/insidermonkey.com/80e5390fb090b46f6fc4addf28b56d3a',
     'width': 140,
     'height': 140,
     'tag': '140x140'}]},
  'relatedTickers': ['LEU', 'URG', 'UUUU', 'NXE', 'DNN', 'COP', 'XOM']},
 {'uuid': '62ebc71f-0e14-345b-b6a1-0aedd66563a5',
  'title': '20 big oil companies expected to be cash gushers in 2023\xa0despite short-term uncertainty',
  'publisher': 'MarketWatch',
  'link': 'https://finance.yahoo.com/m/62ebc71f-0e14-345b-b6a1-0aedd66563a5/20-big-oil-companies-expected.html',
  'providerPublishTime': 1669827840,
  'type': 'STORY',
  'thumbnail': {'resolutions': [{'url': 'https://s.yimg.com/uu/api/res/1.2/vIHFhvh2J4kihTVLWpgqaQ--~B/aD02NDA7dz0xMjgwO2FwcGlkPXl0YWNoeW9u/https://media.zenfs.com/en/marketwatch.com/ba8718e0f1420ce24b536eb1e2882bbc',
     'width': 1280,
     'height': 640,
     'tag': 'original'},
    {'url': 'https://s.yimg.com/uu/api/res/1.2/YH194ZB5o.jFE6QoqhYf_A--~B/Zmk9ZmlsbDtoPTE0MDtweW9mZj0wO3c9MTQwO2FwcGlkPXl0YWNoeW9u/https://media.zenfs.com/en/marketwatch.com/ba8718e0f1420ce24b536eb1e2882bbc',
     'width': 140,
     'height': 140,
     'tag': '140x140'}]},
  'relatedTickers': ['^GSPC', 'XOM']},
 {'uuid': '20849d92-c2aa-35ac-93c4-e19cfb17698c',
  'title': 'Enbridge (ENB), Bad River Tribe to Form Line 5 Oil Spill Plan',
  'publisher': 'Zacks',
  'link': 'https://finance.yahoo.com/news/enbridge-enb-bad-river-tribe-143702979.html',
  'providerPublishTime': 1669819022,
  'type': 'STORY',
  'thumbnail': {'resolutions': [{'url': 'https://s.yimg.com/uu/api/res/1.2/kyxbhc9vU6coF3kOO3p15g--~B/aD00MDA7dz02MzU7YXBwaWQ9eXRhY2h5b24-/https://media.zenfs.com/en/zacks.com/5102c7cc524ab92392c1c3e5f0753c65',
     'width': 635,
     'height': 400,
     'tag': 'original'},
    {'url': 'https://s.yimg.com/uu/api/res/1.2/AvFL3LMAuwgaMyrpIgHyZA--~B/Zmk9ZmlsbDtoPTE0MDtweW9mZj0wO3c9MTQwO2FwcGlkPXl0YWNoeW9u/https://media.zenfs.com/en/zacks.com/5102c7cc524ab92392c1c3e5f0753c65',
     'width': 140,
     'height': 140,
     'tag': '140x140'}]},
  'relatedTickers': ['ENB', 'XOM']},
 {'uuid': '2ed8e903-7ba1-3ad6-826a-eb310749556f',
  'title': '14 Safe Stocks to Buy For Beginner Investors',
  'publisher': 'Insider Monkey',
  'link': 'https://finance.yahoo.com/news/14-safe-stocks-buy-beginner-141318112.html',
  'providerPublishTime': 1669817598,
  'type': 'STORY',
  'thumbnail': {'resolutions': [{'url': 'https://s.yimg.com/uu/api/res/1.2/MJgYp8rBfnoDonXSDu9Awg--~B/aD01MDA7dz03NTA7YXBwaWQ9eXRhY2h5b24-/https://media.zenfs.com/en/insidermonkey.com/c5a299131495043dc9951e0d351ca092',
     'width': 750,
     'height': 500,
     'tag': 'original'},
    {'url': 'https://s.yimg.com/uu/api/res/1.2/W8hLTwS3qdDmoFOoPcwQXw--~B/Zmk9ZmlsbDtoPTE0MDtweW9mZj0wO3c9MTQwO2FwcGlkPXl0YWNoeW9u/https://media.zenfs.com/en/insidermonkey.com/c5a299131495043dc9951e0d351ca092',
     'width': 140,
     'height': 140,
     'tag': '140x140'}]},
  'relatedTickers': ['JNJ',
   'KO',
   'CVX',
   'TSLA',
   'NVDA',
   'MU',
   'XOM',
   'NOW',
   'CRM']}]
In [31]:
# get option chain for specific expiration
opt = xom.option_chain('2023-01-06')
In [32]:
print(opt)
get option chain for specific expiration
opt = xom.option_chain(‘2023-01-06’)
print(opt)
Options(calls=        contractSymbol             lastTradeDate  strike  lastPrice   bid  \
0   XOM230106C00106000 2022-11-30 18:47:17+00:00   106.0       7.50  7.00
1   XOM230106C00107000 2022-11-30 15:11:57+00:00   107.0       6.95  6.35
2   XOM230106C00110000 2022-12-01 17:17:08+00:00   110.0       4.50  4.35
3   XOM230106C00111000 2022-11-30 20:59:20+00:00   111.0       4.47  3.90
4   XOM230106C00112000 2022-12-01 16:20:07+00:00   112.0       3.80  3.35
5   XOM230106C00113000 2022-12-01 15:37:10+00:00   113.0       3.42  2.95
6   XOM230106C00114000 2022-11-30 20:35:13+00:00   114.0       3.25  2.53
7   XOM230106C00115000 2022-12-01 17:01:22+00:00   115.0       2.27  2.20
8   XOM230106C00116000 2022-12-01 14:49:31+00:00   116.0       2.29  1.86
9   XOM230106C00117000 2022-12-01 14:49:31+00:00   117.0       1.96  1.58
10  XOM230106C00118000 2022-12-01 16:04:45+00:00   118.0       1.42  1.32
11  XOM230106C00120000 2022-12-01 17:21:45+00:00   120.0       0.93  0.91
12  XOM230106C00121000 2022-11-30 18:30:12+00:00   121.0       1.00  0.76
13  XOM230106C00122000 2022-11-30 16:31:36+00:00   122.0       0.84  0.63
14  XOM230106C00124000 2022-11-28 17:30:44+00:00   124.0       0.68  0.42
15  XOM230106C00125000 2022-11-30 20:46:09+00:00   125.0       0.49  0.34
16  XOM230106C00126000 2022-12-01 17:06:21+00:00   126.0       0.32  0.28
17  XOM230106C00130000 2022-11-28 16:45:17+00:00   130.0       0.26  0.11
18  XOM230106C00165000 2022-11-25 16:10:05+00:00   165.0       0.05  0.00

     ask  change  percentChange  volume  openInterest  impliedVolatility  \
0   7.15    0.00       0.000000      13            14           0.321418
1   6.50    0.00       0.000000       3             4           0.319709
2   4.50   -0.55     -10.891092       1           215           0.296272
3   4.10    0.00       0.000000      27            30           0.302497
4   3.55   -0.10      -2.564106      21            17           0.295417
5   3.10    0.17       5.230772      10            11           0.292732
6   2.69    0.00       0.000000       3            36           0.290290
7   2.34   -0.42     -15.613385      14            52           0.289436
8   1.97    0.04       1.777776       1             9           0.284309
9   1.70    0.08       4.255321       1            18           0.284431
10  1.43   -0.23     -13.939395       4            21           0.281745
11  1.01   -0.31     -25.000000       8            81           0.279060
12  0.85    0.00       0.000000      13           173           0.279060
13  0.70    0.00       0.000000       3            22           0.277351
14  0.51    0.00       0.000000       1             2           0.281257
15  0.41    0.00       0.000000      13            40           0.279060
16  0.35   -0.11     -25.581400      22             7           0.281501
17  0.17    0.00       0.000000       1             3           0.286140
18  0.07    0.00       0.000000       1             1           0.531255

    inTheMoney contractSize currency
0         True      REGULAR      USD
1         True      REGULAR      USD
2         True      REGULAR      USD
3        False      REGULAR      USD
4        False      REGULAR      USD
5        False      REGULAR      USD
6        False      REGULAR      USD
7        False      REGULAR      USD
8        False      REGULAR      USD
9        False      REGULAR      USD
10       False      REGULAR      USD
11       False      REGULAR      USD
12       False      REGULAR      USD
13       False      REGULAR      USD
14       False      REGULAR      USD
15       False      REGULAR      USD
16       False      REGULAR      USD
17       False      REGULAR      USD
18       False      REGULAR      USD  , puts=        contractSymbol             lastTradeDate  strike  lastPrice    bid  \
0   XOM230106P00100000 2022-11-30 20:49:27+00:00   100.0       0.87   0.92
1   XOM230106P00102000 2022-11-30 19:01:08+00:00   102.0       1.24   1.21
2   XOM230106P00103000 2022-12-01 16:03:23+00:00   103.0       1.35   1.40
3   XOM230106P00105000 2022-12-01 16:13:43+00:00   105.0       1.75   1.85
4   XOM230106P00106000 2022-12-01 15:47:29+00:00   106.0       1.97   2.13
5   XOM230106P00108000 2022-12-01 15:07:12+00:00   108.0       2.39   2.74
6   XOM230106P00109000 2022-12-01 15:15:11+00:00   109.0       2.73   3.10
7   XOM230106P00110000 2022-12-01 16:07:29+00:00   110.0       3.50   3.50
8   XOM230106P00111000 2022-12-01 15:38:03+00:00   111.0       3.65   3.95
9   XOM230106P00112000 2022-12-01 16:35:17+00:00   112.0       4.20   4.60
10  XOM230106P00113000 2022-11-30 19:32:10+00:00   113.0       4.80   5.00
11  XOM230106P00114000 2022-12-01 16:34:07+00:00   114.0       5.25   5.60
12  XOM230106P00115000 2022-12-01 15:19:20+00:00   115.0       5.65   6.25
13  XOM230106P00119000 2022-11-30 18:13:56+00:00   119.0       9.65   9.15
14  XOM230106P00121000 2022-11-30 18:59:59+00:00   121.0      10.40  10.85
15  XOM230106P00126000 2022-11-28 14:31:07+00:00   126.0      15.90  15.40

      ask  change  percentChange  volume  openInterest  impliedVolatility  \
0    1.01    0.00       0.000000     320           404           0.333503
1    1.32    0.00       0.000000     235           250           0.322394
2    1.52   -0.43     -24.157300       1            26           0.318366
3    1.96   -0.25     -12.500000      23            98           0.307136
4    2.23   -0.58     -22.745096       4             8           0.302253
5    2.90   -0.81     -25.312498      17           524           0.295417
6    3.30   -0.32     -10.491801      10            92           0.292976
7    3.70    0.31       9.717866      43           491           0.287727
8    4.15   -0.19      -4.947912      82           113           0.283454
9    4.70    0.05       1.204812       3            61           0.283332
10   5.20    0.00       0.000000       1             4           0.276863
11   5.80   -0.45      -7.894734       7            10           0.274788
12   6.45   -0.95     -14.393937       3            56           0.273445
13   9.35    0.00       0.000000       8            18           0.263435
14  11.15    0.00       0.000000       1             6           0.276863
15  15.75    0.00       0.000000       1             0           0.296150

    inTheMoney contractSize currency
0        False      REGULAR      USD
1        False      REGULAR      USD
2        False      REGULAR      USD
3        False      REGULAR      USD
4        False      REGULAR      USD
5        False      REGULAR      USD
6        False      REGULAR      USD
7        False      REGULAR      USD
8         True      REGULAR      USD
9         True      REGULAR      USD
10        True      REGULAR      USD
11        True      REGULAR      USD
12        True      REGULAR      USD
13        True      REGULAR      USD
14        True      REGULAR      USD
15        True      REGULAR      USD  )


Make a one-time donation
Make a monthly donation
Make a yearly donation
Choose an amount
Or enter a custom amount
Your contribution is appreciated.
Your contribution is appreciated.
Your contribution is appreciated.

Leave a comment