Category: Business Intelligence
-
Interactive Global COVID-19 Data Visualization with Plotly

COVID-19, caused by SARS-CoV-2 virus, has affected 227.2 million people and caused 4,672,629 deaths. The disease, first reported in Wuhan, has spread globally. Data visualization tools like Plotly and analysis of Kaggle datasets provide insights into the pandemic’s impact, with the US leading in confirmed cases and deaths. China has managed to control the spread.
-
A Roadmap from Data Science to BI via ML

The blog post presents a comprehensive roadmap to Data Science (DS), providing an overview of career prospects, the field’s intersections with Mathematics, Statistics, and Computer Science, and its business relevance. The text details the earning potential of data scientists and the steps towards becoming one, including Data Analysis, Machine Learning, and Business Intelligence. It highlights…
-
DJI Market State Analysis using the Cruz Fitting Algorithm

Based upon the Cruz stochastic fitting algorithm and the colab code implementing a Hidden Markov Model, let’s predict the DJI stock returns from 1970 to 2022 and detect three states such as bull (green), sideways (yellow) and bear (red) markets. Let’s set the working directory YOURPATH import osos.chdir(‘YOURPATH’) os. getcwd() and import/install the following libraries…
-
Cloud-Native Tech Autumn 2022 Fair

Let’s dive deeper into the cloud-native tech trends and features to follow in Q4 2022 and beyond. Contents: Markets Services Serverless Cybersecurity DevSecOps ML/AI/IoT Use-Cases Events Training Explore More Infographic
-
BTC-USD Price Prediction with LSTM

The objective of this project is to test the deep learning algorithm of real-time BTC-USD price prediction. We trained the 2-layers Long Short Term Memory Neural Network using Bitcoin Historical Data. The trained LSTM model can be used to predict future price movements of bitcoin. RMSE ~ $64, with the mean price of $20k (Oct…
-
Top 10 Most Upvoted Apps Sept ’22

Following Leon Zucchini, let’s consider the latest roundup of the 10 most upvoted brand-new apps, hits on ProductHunt in September 2022. These are xTiles Polywork MeltingSpot Arcade Appwrite Jimo Popsy Typed Growth.Design and of course the best search engine Curiosity.
-
Power BI for Data Scientists

Power BI is a business analytics tool that provides interactive data visualization capabilities, advanced analytics, and artificial intelligence. Power BI’s AI features include image recognition, text analytics, key driver analysis, and machine learning model building. It offers cloud-based services and a desktop-based interface, allowing data preparation, data discovery, and interactive dashboarding. Supported by Windows, Android,…
-
Technology Focus Weekly Update 16 Oct ’22

Get top data-driven technology highlights of the week: new SaaS products, tech business applications and learnings of the week: DevOps, DevSecOps, Cybersecurity, public cloud platforms (AWS/GCP/Azure), MarTech, ML/AI, MLOPs, NLP, edtech, e-courses, upcoming events, and related Infographics. Contents: DevOps November 8th, 2022 | 11 a.m. ET Providing reliable and secure services doesn’t just happen. Traditionally,…
-
The Zacks Steady Investor – A Quick Look

Featured Photo by Bram Naus on Unsplash Let’s look at what is going on in the U.S. markets and the current Zacks’s view for investors to consider (as of Sunday, 9 October 2022).
-
Marketing Q3 ’22 Round-Up

This is review of Marketing Q3 ’22 trends: medium digest Hubspot Insights All of SEO
-
Portfolio Optimization Risk/Return QC – Positions of Humble Div vs Dividend Glenn
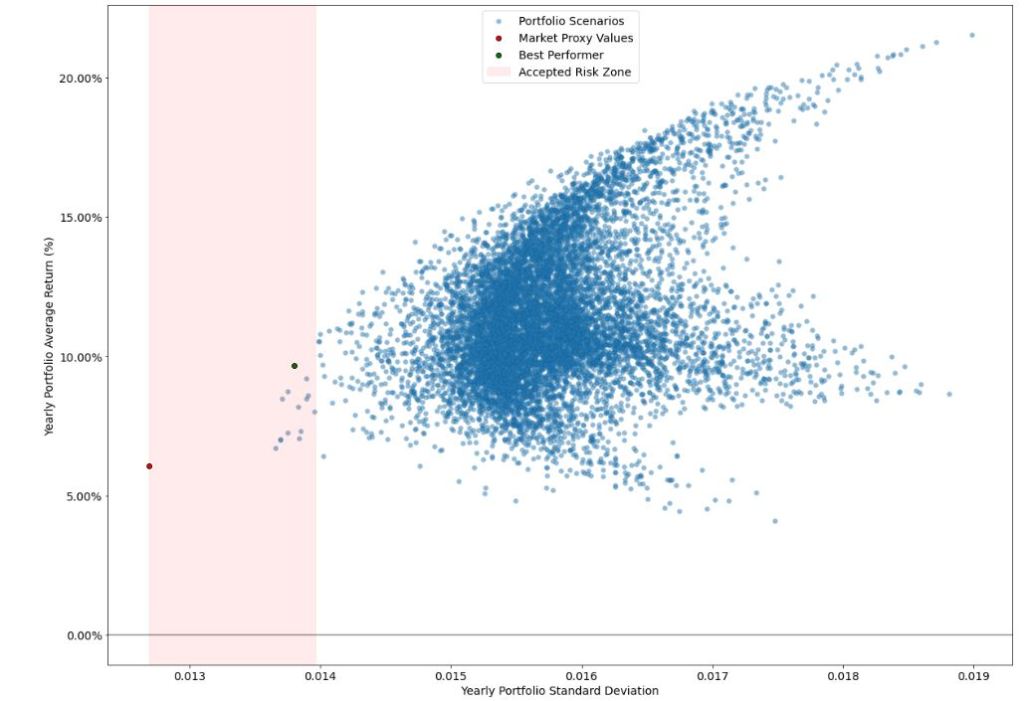
The Portfolio Optimization Algorithm (POA) is used for comparing the top five stock positions of Humble Div (HD) and Dividend Glenn (DG) from 2017 to 2022. The Risk/Return Ratio (RRR) shows HD portfolio as a better performer than DG portfolio and the market. Both portfolios and market are within risk boundaries.
-
US Real Estate – Harnessing the Power of AI

The content describes a continuation of the use-case series dedicated to real estate (RE) monitoring, trend analysis, and forecast. It focuses on predicting and estimating US house prices using a pre-trained ML model. The content covers various machine learning algorithms, data preprocessing, model training, and evaluation using the Boston housing price dataset. Key takeaways include…
-
Cloud-Native Tech Status Update Q3 2022

Cloud Computing Trends Q3 2022, market Share update key services IaaS PaaS FaaS Saas Cloud digital transformation all-the-way DevSecOps CI/Cd GitLab MLOps IoT Tech GCP gateway Big data Deloitte use-cases Stock markets Health Tech Cybersecurity Highlights Events Webinars AWS Storage E-training
-
The Qullamaggie’s TSLA Breakouts for Swing Traders

The content explains a Python-based stock scanner project that analyses TSLA’s historical data downloaded from Yahoo Finance. It applies a set of functions to identify stocks meeting growth criteria and checks for consolidation. The output is a series of plots showing original close price vs filtered data or breakouts. The scanner aims to help swing…
-
Marketing Summer 2022 Update

Hubspot Marketing Summer 2022 Update: Brand Consistency 4 Personalization Trends + Tips US Consumer Trends 20 Content Marketing Examples 9 Automation Trends Top Shopping Trends 8 Easy SEO Basics Social Media Checklist Social Media Daily Checklist SME Marketing Ideas Tik-Tok Marketing Highlights YouTube Thumbnail Ecommerce SEO Strategy ABM Strategy Job Simulations – HR 20 Webinar…
-
Simple E-Commerce Sales BI Analytics

Good businesses learn from previous efforts and test future ideas using e-commerce analytics (ECA). ECA enable you to delve deep into historical BI data, and future forecasting so that you can make the optimized business decisions. The key benefits of ECA are as follows: Let’s look at the warehouse optimization problem by analyzing Kaggle sales…
