
- In this post, we will apply Low-Code AutoEDA of NZa/DIS Dutch eHealth Data with D-Tale, SweetViz, YData-Profiling, Pandas GUI, and PyGWalker Libraries in Python.
- The input DIS open-source dataset has been released with the permission of Dutch Healthcare Authority (NZa).
- The main goal of the study is to get a full understanding of the healthcare data and draw attention to its most important features in order to prepare it for applying more advanced data science techniques and feeding into AI algorithms.
- Motivation: The Dutch government wants to encourage the use of digital applications for healthcare and support. Since the coronavirus crisis, smart solutions – from personal blood pressure monitors to apps that monitor health and activity – have become more and more important in everyday care.
Input Data
- Setting the working directory YOURPATH
import os
os.chdir('YOURPATH')
os. getcwd()
- Reading the input dataset
import pandas as pd

df = pd.read_excel('01_DBC.xlsx')
df.head()
	VERSIE	DATUM_BESTAND	PEILDATUM	JAAR	BEHANDELEND_SPECIALISME_CD	TYPERENDE_DIAGNOSE_CD	ZORGPRODUCT_CD	AANTAL_PAT_PER_ZPD	AANTAL_SUBTRAJECT_PER_ZPD	AANTAL_PAT_PER_DIAG	AANTAL_SUBTRAJECT_PER_DIAG	AANTAL_PAT_PER_SPC	AANTAL_SUBTRAJECT_PER_SPC	GEMIDDELDE_VERKOOPPRIJS
0	10	2023-10-13	2023-10-01	2013	389	998.0	990089076	4	4	12805	13490	197275	284602	NaN
1	10	2023-10-13	2023-10-01	2013	389	14.0	990089093	391	442	733	1055	197275	284602	250.0
2	10	2023-10-13	2023-10-01	2013	389	120.0	990089032	5	11	932	1353	197275	284602	NaN
3	10	2023-10-13	2023-10-01	2013	389	44.0	990089009	4	4	4883	7511	197275	284602	20760.0
4	10	2023-10-13	2023-10-01	2013	389	15.0	990089060	106	126	923	1314	197275	284602	1125.0
df.info()
<class 'pandas.core.frame.DataFrame'>
RangeIndex: 344667 entries, 0 to 344666
Data columns (total 14 columns):
 #   Column                      Non-Null Count   Dtype
---  ------                      --------------   -----
 0   VERSIE                      344667 non-null  int64
 1   DATUM_BESTAND               344667 non-null  datetime64[ns]
 2   PEILDATUM                   344667 non-null  datetime64[ns]
 3   JAAR                        344667 non-null  int64
 4   BEHANDELEND_SPECIALISME_CD  344667 non-null  int64
 5   TYPERENDE_DIAGNOSE_CD       332971 non-null  float64
 6   ZORGPRODUCT_CD              344667 non-null  int64
 7   AANTAL_PAT_PER_ZPD          344667 non-null  int64
 8   AANTAL_SUBTRAJECT_PER_ZPD   344667 non-null  int64
 9   AANTAL_PAT_PER_DIAG         344667 non-null  int64
 10  AANTAL_SUBTRAJECT_PER_DIAG  344667 non-null  int64
 11  AANTAL_PAT_PER_SPC          344667 non-null  int64
 12  AANTAL_SUBTRAJECT_PER_SPC   344667 non-null  int64
 13  GEMIDDELDE_VERKOOPPRIJS     290291 non-null  float64
dtypes: datetime64[ns](2), float64(2), int64(10)
memory usage: 36.8 MB
df.shape
(344667, 14)
df.describe().T
count mean std min 25% 50% 75% max
VERSIE 344667.0 1.000000e+01 0.000000e+00 10.0 10.0 10.0 10.0 10.0
JAAR 344667.0 2.017381e+03 3.359640e+00 2012.0 2014.0 2017.0 2020.0 2023.0
BEHANDELEND_SPECIALISME_CD 344667.0 4.501432e+02 1.035571e+03 301.0 305.0 313.0 322.0 8418.0
TYPERENDE_DIAGNOSE_CD 332971.0 1.286993e+03 1.811106e+03 0.0 253.0 702.0 1521.0 9999.0
ZORGPRODUCT_CD 344667.0 4.409161e+08 4.290094e+08 10501002.0 99799062.0 149599027.0 990004002.0 998418081.0
AANTAL_PAT_PER_ZPD 344667.0 5.100984e+02 3.179708e+03 1.0 3.0 13.0 101.0 165184.0
AANTAL_SUBTRAJECT_PER_ZPD 344667.0 6.046430e+02 4.104053e+03 1.0 3.0 14.0 111.0 240002.0
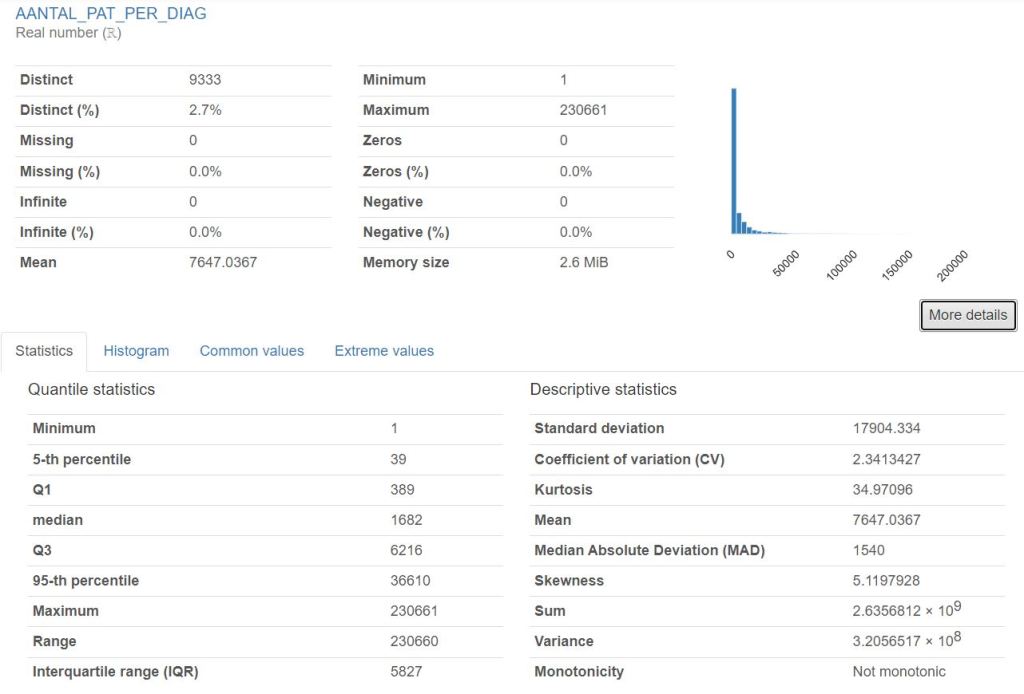
AANTAL_PAT_PER_DIAG 344667.0 7.647037e+03 1.790433e+04 1.0 389.0 1682.0 6216.0 230661.0
AANTAL_SUBTRAJECT_PER_DIAG 344667.0 1.109071e+04 2.687193e+04 1.0 513.0 2334.0 9027.0 370139.0
AANTAL_PAT_PER_SPC 344667.0 6.648557e+05 4.208325e+05 1610.0 256043.0 757852.0 1026299.0 1487633.0
AANTAL_SUBTRAJECT_PER_SPC 344667.0 1.079684e+06 7.563075e+05 1861.0 365047.0 1106917.0 1790741.0 2664317.0
GEMIDDELDE_VERKOOPPRIJS 290291.0 3.582533e+03 6.522753e+03 70.0 475.0 1240.0 4155.0 287220.0
df.isna().sum().sum()

66072
SweetViz
- Sweetviz can be used to create summary statistics and quick data visualizations for data profiling and comparisons.
import sweetviz as sv
import pandas as pd

# Create an analysis report for your data
report = sv.analyze(df)

# Display the report
report.show_html()


YData-Profiling
- YData-Profiling creates an interactive HTML report that displays various summary statistics and visualizations of a given Pandas DataFrame.
import numpy as np
import pandas as pd
from ydata_profiling import ProfileReport
profile = ProfileReport(df, title="Pandas Profiling Report")
profile.to_file("pandas_profiling__report.html")


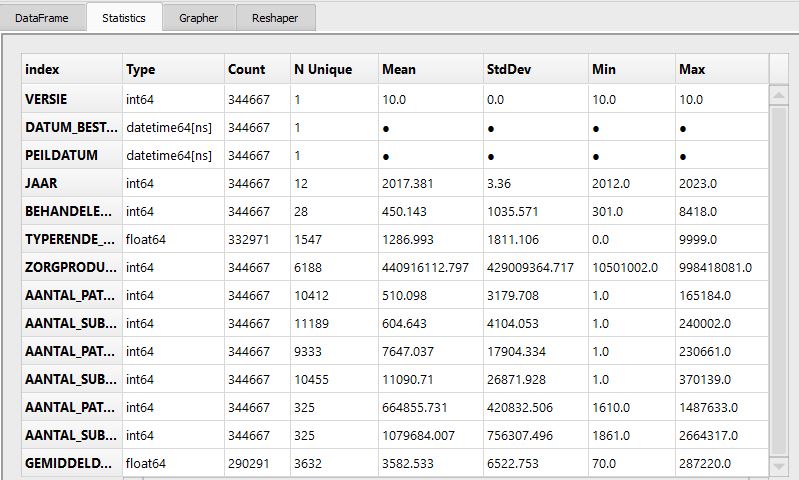
D-Tale
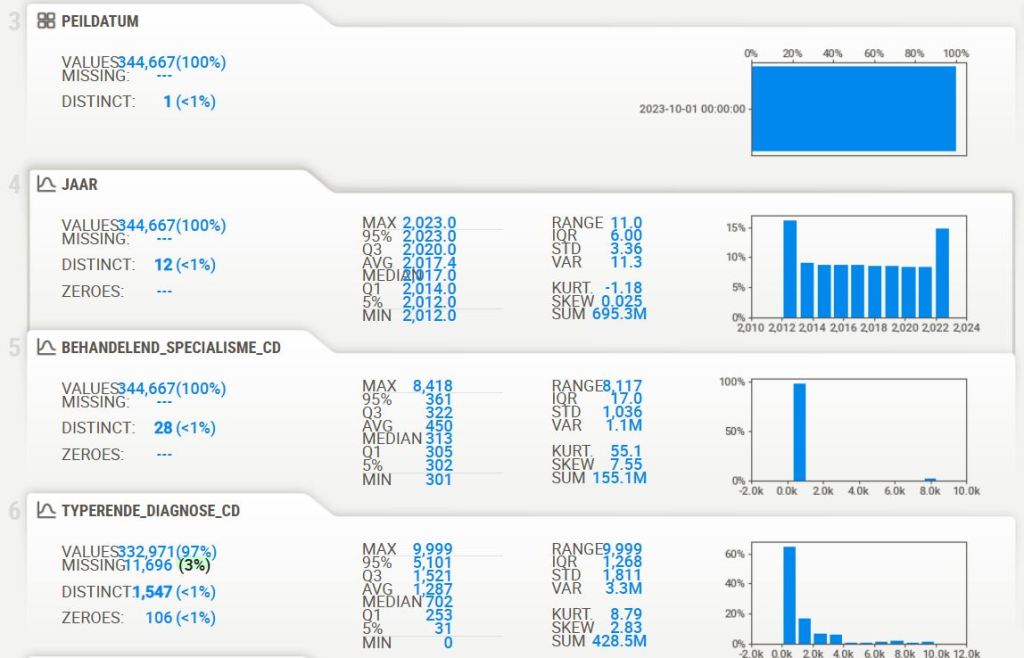
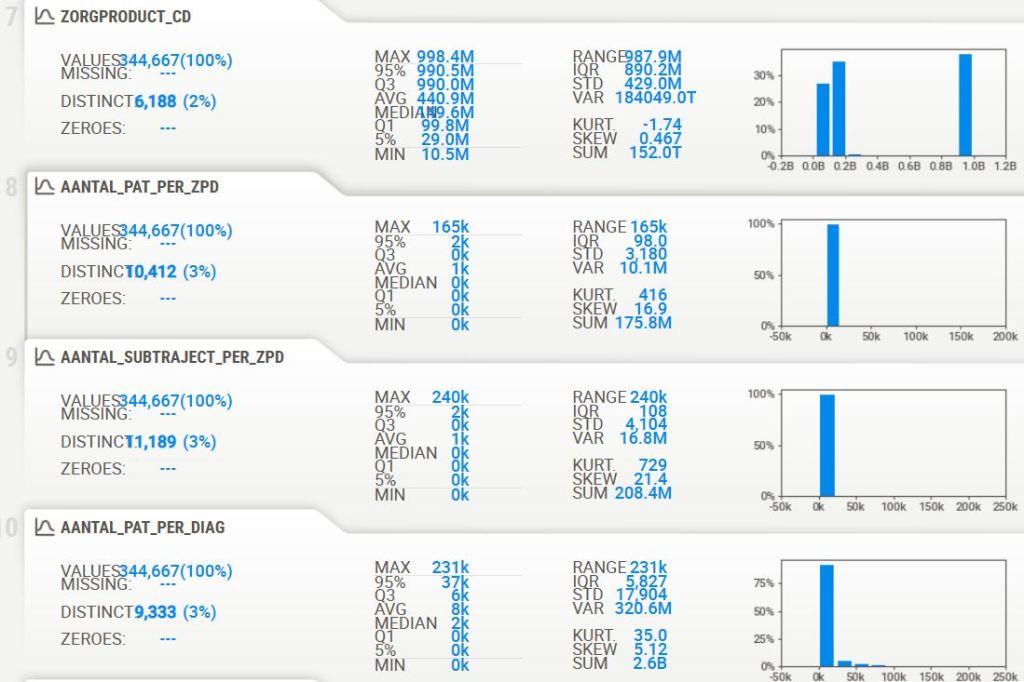
- D-Tale provides an interactive web-based interface for EDA, making it easier to perform data analysis and visualization tasks.
import dtale

dtale.show(df)


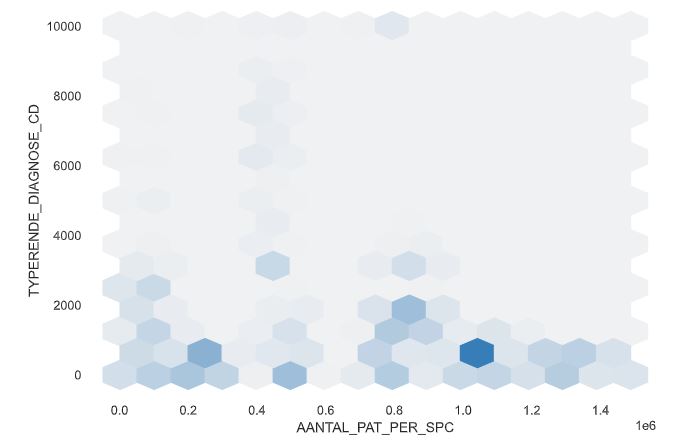
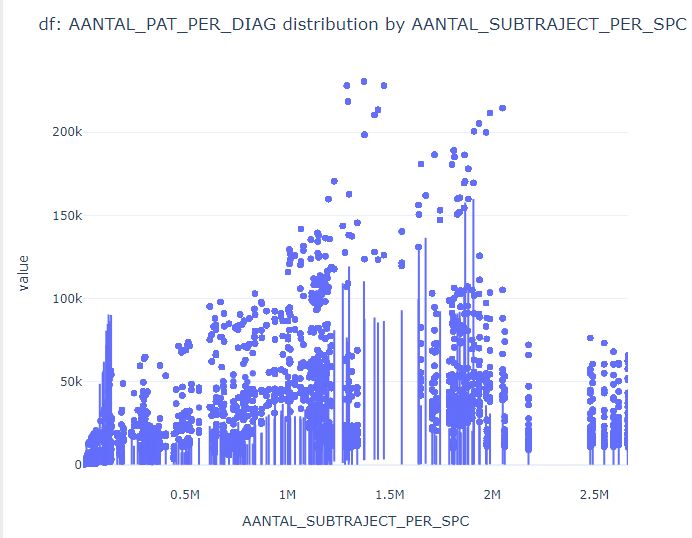
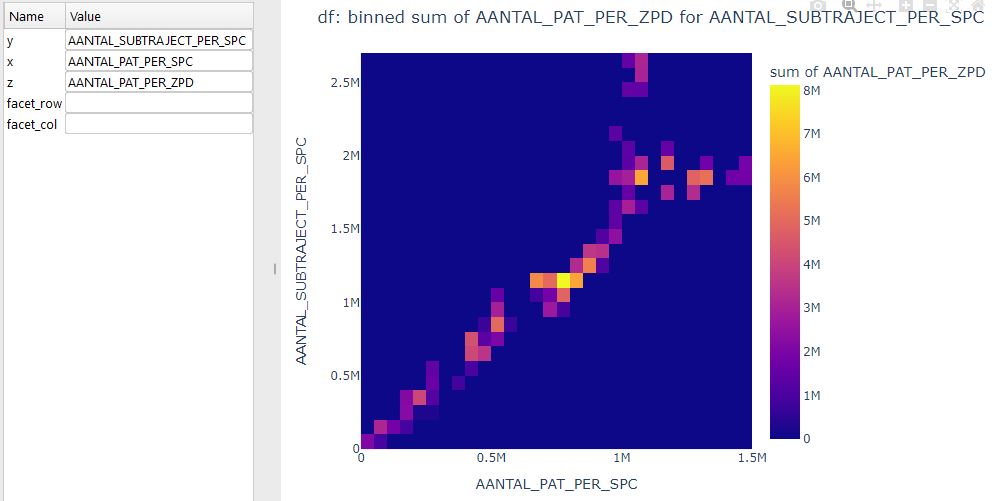
PyGWalker
- PyGWalker is a powerful and easy-to-use Python library for data exploration and visualization. It is integrated with Jupyter Notebook, which makes it easy to create and share visualizations. PyGWalker supports a wide range of data types and visualizations, and it is free to use and open-source.
import pygwalker as pyg
import pandas as pd
pyg.walk(df)


Other Libraries
- PandasGUI is a GUI for viewing, plotting and analyzing Pandas DataFrames.
from pandasgui import show

show(df)

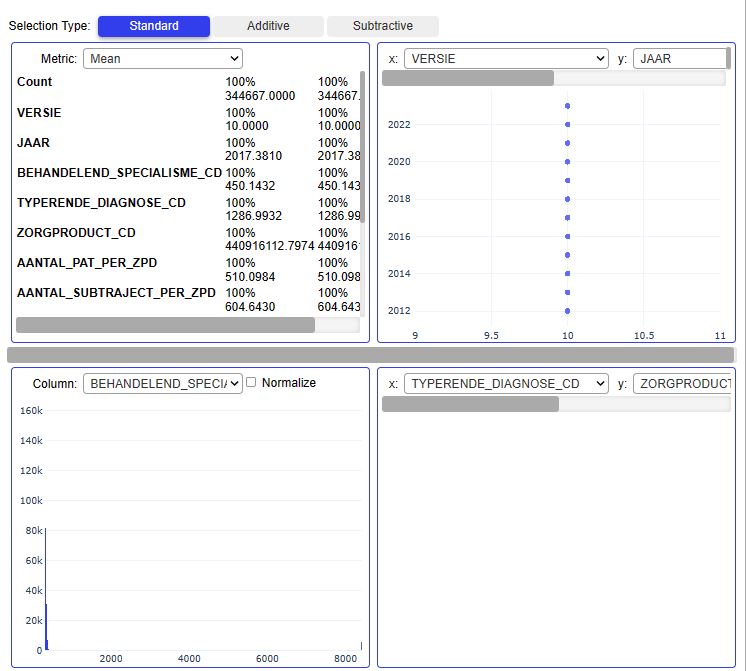
Pandas VisualAnalysis is a package for interactive visual analysis in Jupyter notebooks.
from pandas_visual_analysis import VisualAnalysis
VisualAnalysis(df)
- Read more about other libraries such as Lux, AutoViz_Class, missingno, DataPrep, QuickDA, Datatile, amd ExploriPy here.
Summary
- The Python Low-Code AutoEDA proposed in this study is to make Exploratory Data Analysis (EDA) of people’s health condition based on remote health care monitoring systems in their different activities.
- The numerical studies have been carried out based on the real-world NZa eHealth dataset.
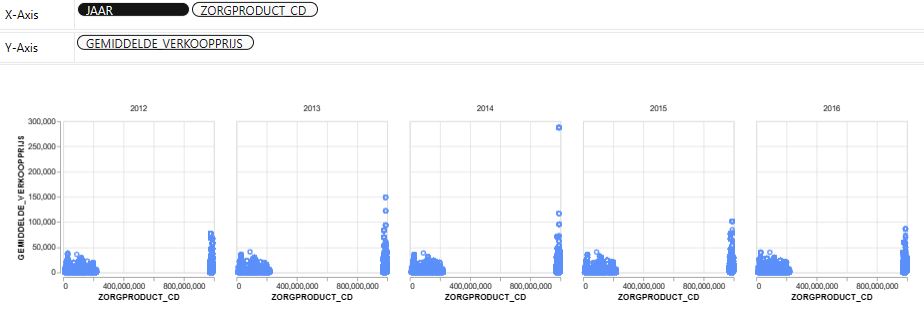
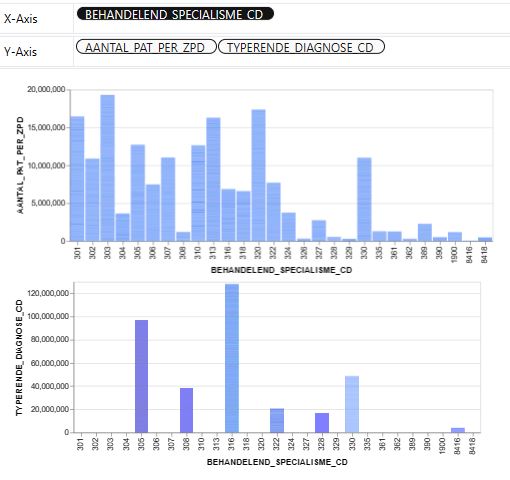
- Available data visualization tools include box and whisker plots, histograms, scatter plots, bar and pie charts, violin plots, correlation matrices, and more.
- Our analysis helps to generate hypotheses about the dataset, detect its anomalies and reveal the structure.
- The final results are presented as both GUI and interactive HTML reports containing the following information:
- Data types and file structure/shape
- Unique/missing/duplicate values
- Quantile statistics — minimum, Q1, median, Q3, maximum, range, IQR
- Descriptive statistics — mean, mode, standard deviation, sum, median absolute difference, coefficient of variation, kurtosis, skewness, etc.
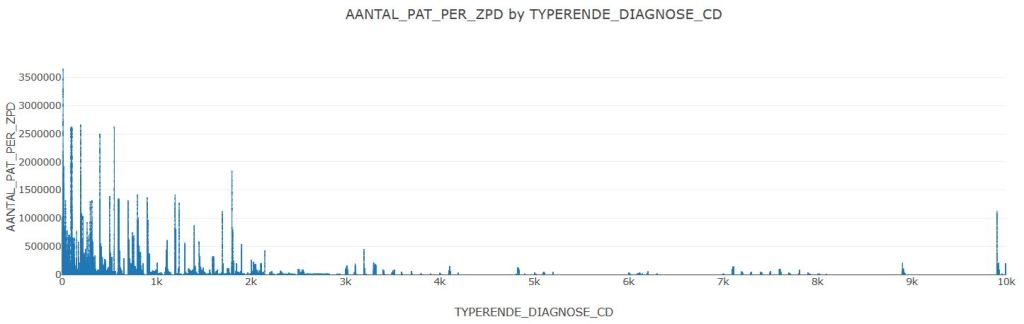
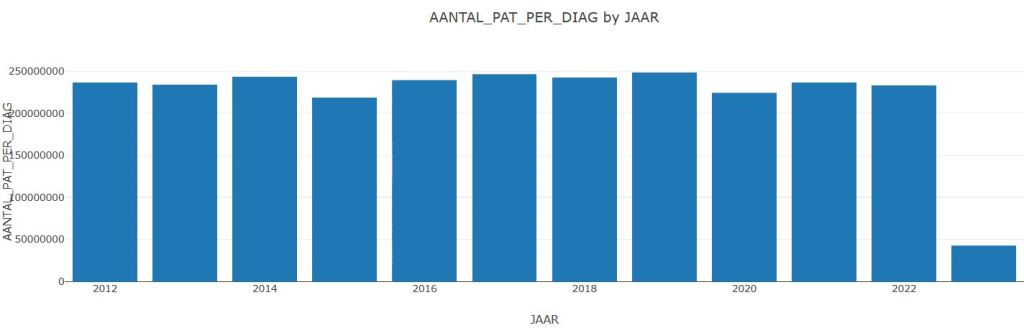
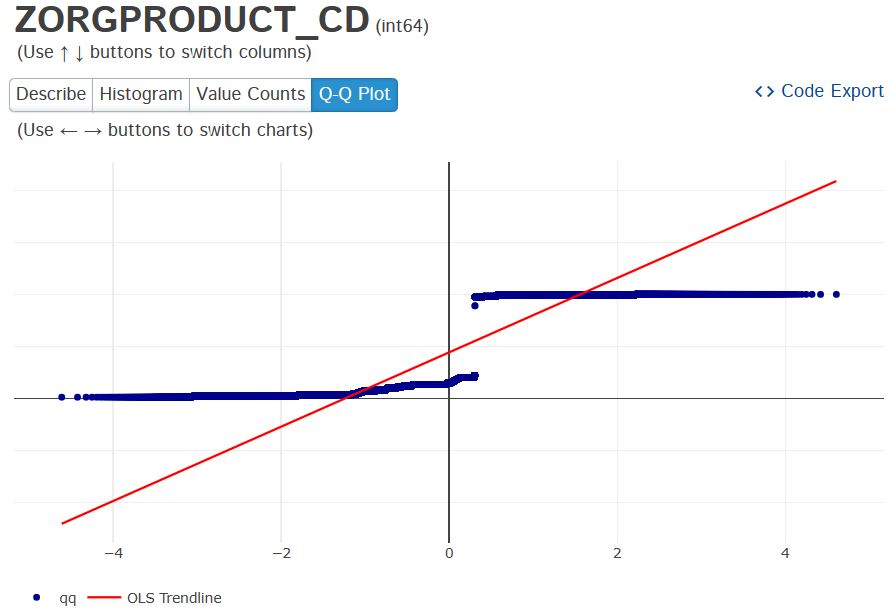
- Plots: Histograms, Q-Q, bar plot, pie chart, violins, scatter plots, etc.
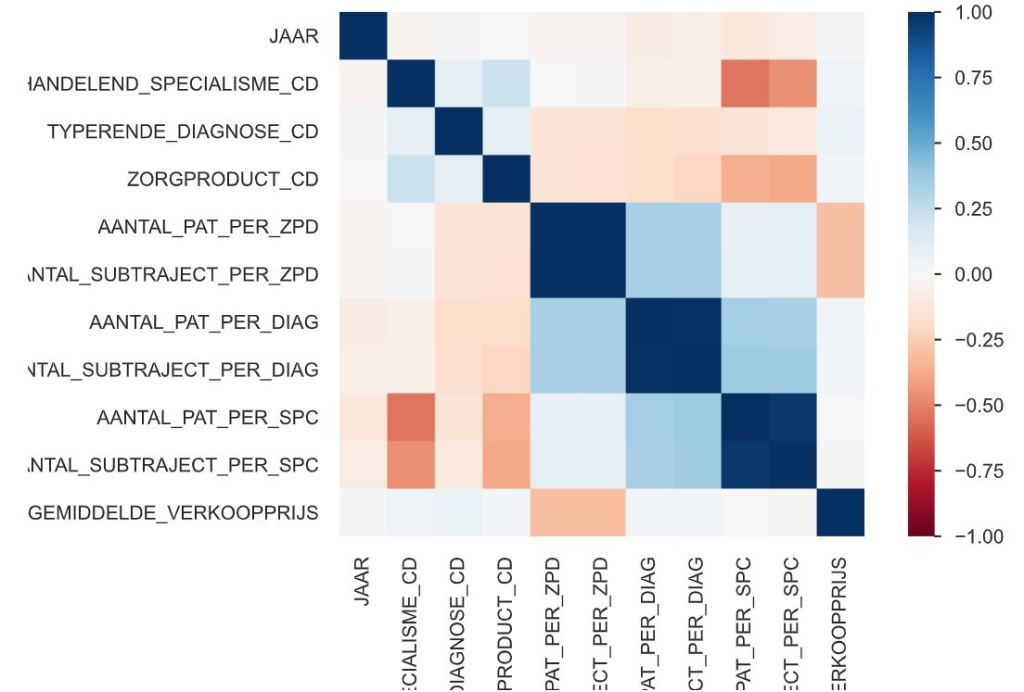
- Correlations as heatmaps and tables
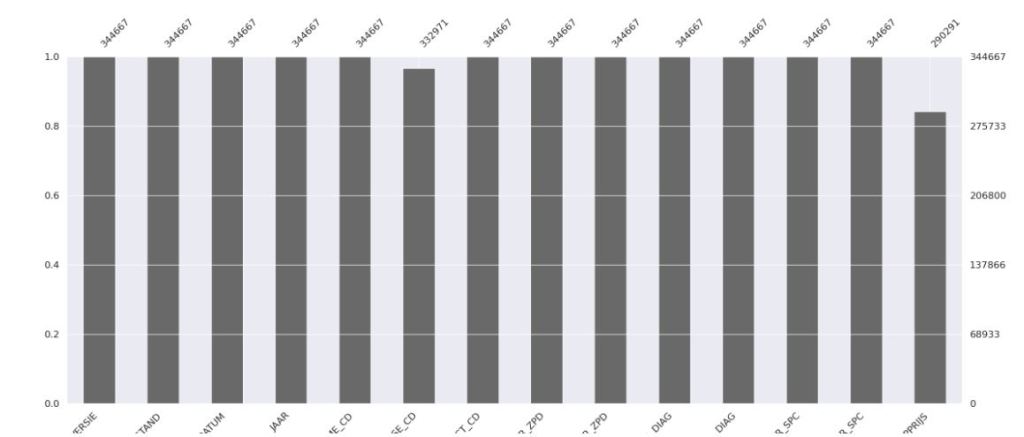
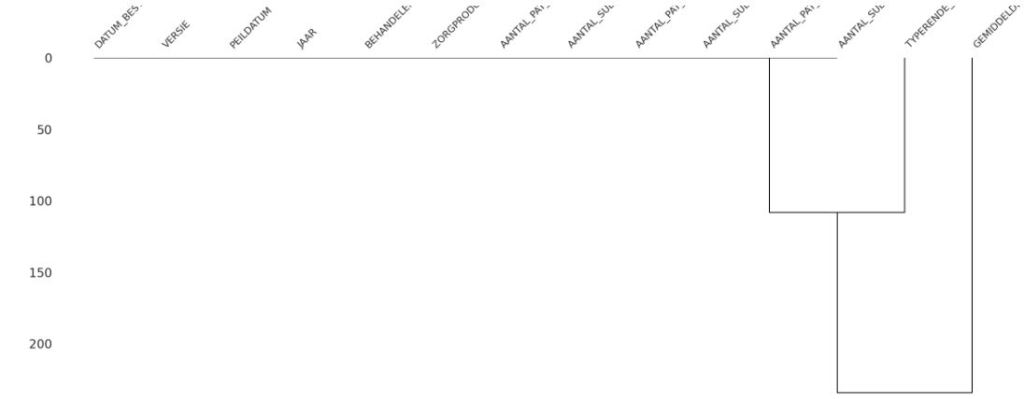
- Missing values: matrices, counts, heatmaps, and dendrograms of missing values.
- Here’s how our AutoEDA approach empowers eHealth with its following essential benefits:
- Understand data quality
- Identify data issues
- Understand data structure and relationships
- Mitigate risk
- Support data governance
- Facilitate data democratization
- Support data integration
- Enhance efficiency of data-driven processes
- Understand customer behavior
- Cost savings
- Ensure compliance.
- In conclusion, AutoEDA is a crucial step in any data science project. It provides a deeper understanding of the data and its underlying patterns, which can then be leveraged to generate useful business insights leading to data-driven decision making.
Explore More
- A Comparison of Automated EDA Tools in Python: Pandas-Profiling vs SweetViz
- Advanced Integrated Data Visualization (AIDV) in Python – 2. Dabl Auto EDA & ML
- AI-Guided Drug Recommendation
- Drug Review Data Analytics
- Diabetes Prediction using ML/AI in Python


One-Time
Monthly
Yearly
Make a one-time donation
Make a monthly donation
Make a yearly donation
Choose an amount
€5.00
€15.00
€100.00
€5.00
€15.00
€100.00
€5.00
€15.00
€100.00
Or enter a custom amount
€
Your contribution is appreciated.
Your contribution is appreciated.
Your contribution is appreciated.
DonateDonate monthlyDonate yearly
Leave a comment