
- Exploratory Data Analysis (EDA) is a crucial step in any data science project.
- Its primary goals include discovering patterns, identifying anomalies, and finding relationships between variables.
- EDA can be broken down into different types of descriptive statistical analyses, such as univariate, bivariate, and multivariate data analytics.
- Automation can be used to conduct EDA, allowing for faster and more efficient analysis of data.
- Data scientists can utilize automated EDA tools to accelerate the time-consuming data preparation phase, minimize ETL errors, and gain a more complete from A to Z understanding of input data.
- This post will compare some popular Python libraries to automate EDA. The goal is to examine every aspect of the EDA procedure, including data cleaning, data visualization, and statistical analysis. Specifically, we will compare the types and quality of visualizations each tool supports.
Table of Contents
Pandas-Profiling
Let’s set the working directory
import os
os.chdir(‘YOURPATH’)
os. getcwd()
import the key libraries and load the input data
import pandas as pd
from pandas_profiling import ProfileReport
df = pd.read_csv(“https://people.sc.fsu.edu/~jburkardt/data/csv/airtravel.csv”)
Let’s generate the HTML report
profile = ProfileReport(df, title=”Pandas Profiling Report”)
profile.to_file(“report.html”)
Let’s look at the report

Interactions:

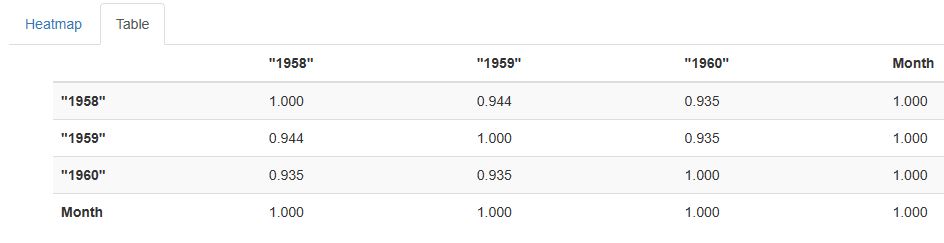
Correlations: Heatmap

Correlations: Table
SweetViz
Let’s import the key libraries
import sweetviz as sv
import pandas as pd
and proceed with the same dataset as above, viz.
df = pd.read_csv(“https://people.sc.fsu.edu/~jburkardt/data/csv/airtravel.csv”)
Let’s create and display an analysis report for our data
report = sv.analyze(df)
Done! Use ‘show’ commands to display/save
report.show_html()
Report SWEETVIZ_REPORT.html was generated! NOTEBOOK/COLAB USERS: the web browser MAY not pop up, regardless, the report IS saved in your notebook/colab files.
Let’s look at the report
Other Libraries
Other automation libraries that can assist in EDA are as follows (cf. References):
Dataprep, D-tale, Pandas GUI, Dabl, Bamboolib, AutoViz, Dora, Visidata, Scattertext, QuickDA, ExploriPy, Rath, and Lux.
Summary
- Automated EDA libraries can perform data analysis, wrangling, editing, cleaning, visualization, and ETL transformations in a few lines of Python code.
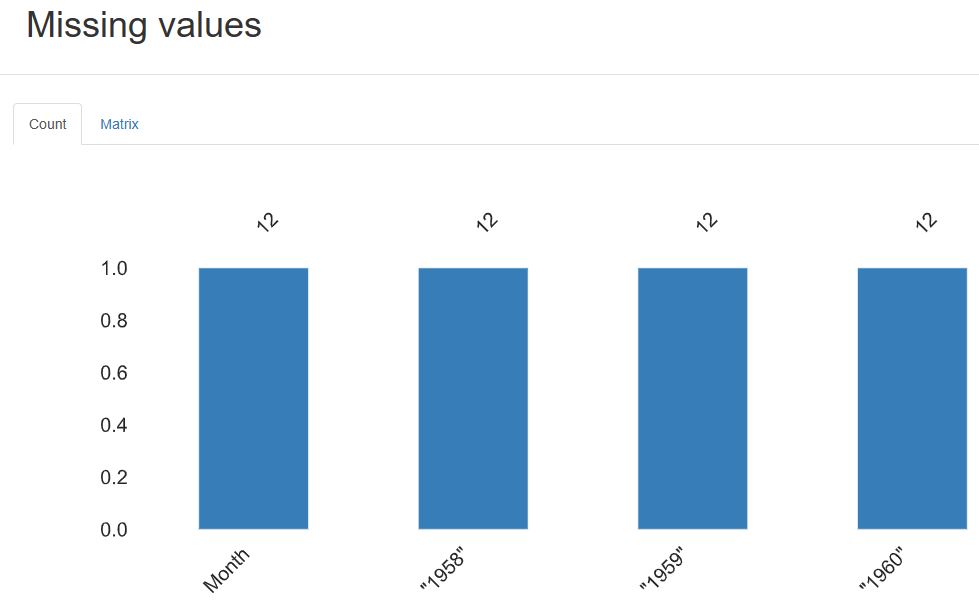
- Pandas-Profiling creates an interactive HTML report that displays various summary statistics and visualizations of a given Pandas DataFrame.
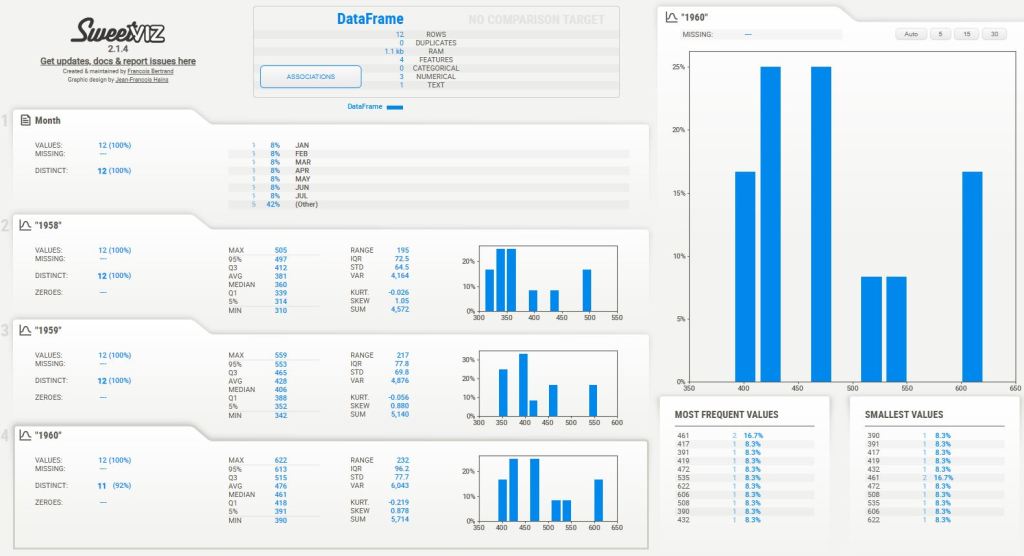
- SweetViz also creates an HTML report with visualizations that provide insights into the data, including distributions of features, missing values, and correlations between features (Associations).
- The visualizations can be customized and fine-tuned as needed to best suit your EDA needs.
- These tools are especially powerful for marketers, salespeople and BI analysts looking to perform data analysis and present their data to stakeholders.
Explore More
- Advanced Integrated Data Visualization (AIDV) in Python – 2. Dabl Auto EDA & ML
- Joint Analysis of Bitcoin, Gold and Crude Oil Prices with Optimized Risk/Return in 2023
References
- How to automate the Exploratory Data Analysis process?
- Automatic EDA – Python
- Step By Step Guide To Automated Exploratory Data Analysis Using Sweetviz in Python
- Top Python Libraries to Automate Exploratory Data Analysis in 2021
- 10 automated EDA libraries in one place
- Comparing the Five Most Popular EDA Tools
- 10 Automated EDA Tools That Will Save You Hours Of Work
- Best Libraries That Will Assist You In EDA


Make a one-time donation
Make a monthly donation
Make a yearly donation
Choose an amount
Or enter a custom amount
Your contribution is appreciated.
Your contribution is appreciated.
Your contribution is appreciated.

Leave a comment