
Photo by Pablo Merchán Montes on Unsplash
Tripadvisor, Inc. is an American internet-based travel company headquartered in Needham, MA. Its branded sites and forums operate as online travel guides offering free user-generated reviews of travel-related content, tools for price comparisons, and online travel booking services. As of 2022, Tripadvisor’s total number of user reviews and ratings reached approximately one billion, covering listings for restaurants, hotels, vacation rentals, experiences, and attractions.
Following the recent Kaggle studies, let’s examine the restaurant guest reviews on Tripadvisor (TA) in terms of their experiences in eating out in Europe.
In this post, we will do sentiment classification of TA restaurant reviews in Europe and develop recommendation system via restaurant description,summary and user comments.
Goal: we will be exploring the restaurant reviews and the rating base on customer experience.
How Important Are Online Reviews?
In an ultra-competitive market like Europe, a restaurant’s online reviews can mean make-or-break. Restaurant owners are fully aware of the importance of customer reviews and doing everything possible to boost their online image.
We will answer the following relevant questions:
- Are there differences in average ratings and number of ratings between cities?
- Are there more vegetarian-friendly cities and if so, are they locally concentrated?
- Is local cuisine rated better than foreign cusine and if so, is there a difference between cities?
Disclaimer:
Review websites such as TA are built on credibility. Biased or inflated reviews can have a detrimental effect on user trust.
Table of Contents
About Dataset
This Kaggle dataset has been obtained by scraping TA ratings and reviews for restaurants across 31 European cities.
The dataset contain restaurants information for 31 cities in Europe: Amsterdam (NL), Athens (GR) , Barcelona (ES) , Berlin (DE), Bratislava (SK), Bruxelles (BE), Budapest (HU), Copenhagen (DK), Dublin (IE), Edinburgh (UK), Geneva (CH), Helsinki (FI), Hamburg (DE), Krakow (PL), Lisbon (PT), Ljubljana (SI), London (UK), Luxembourg (LU), Madrid (ES), Lyon (FR), Milan (IT), Munich (DE), Oporto (PT), Oslo (NO), Paris (FR), Prague (CZ), Rome (IT), Stockholm (SE), Vienna (AT), Warsaw (PL), Zurich (CH).
It is structured as follow:
- Name: name of the restaurant
- City: city location of the restaurant
- Cuisine Style: cuisine style(s) of the restaurant, in a Python list object (94 046 non-null)
- Ranking: rank of the restaurant among the total number of restaurants in the city as a float object (115 645 non-null)
- Rating: rate of the restaurant on a scale from 1 to 5, as a float object (115 658 non-null)
- Price Range: price range of the restaurant among 3 categories , as a categorical type (77 555 non-null)
- Number of Reviews: number of reviews that customers have let to the restaurant, as a float object (108 020 non-null)
- Reviews: 2 reviews that are displayed on the restaurants scrolling page of the city, as a list of list object where the first list contains the 2 reviews, and the second le dates when these reviews were written (115 673 non-null)
- URL_TA: part of the URL of the detailed restaurant page that comes after ‘www.tripadvisor.com’ as a string object (124 995 non-null)
- ID_TA: identification of the restaurant in the TA database constructed a one letter and a number (124 995 non-null).
Data Preparation
Let’s set the working directory, import the key libraries, load the input dataset and examine the data structure
import os
os.chdir(‘YOURPATH’)
os. getcwd()
import pandas as pd
import numpy as np
import matplotlib.pyplot as plt
import seaborn as sb
import re
from collections import Counter
from PIL import Image
%matplotlib inline
df_ta_reviews = pd.read_csv(‘TA_restaurants_curated.csv’, encoding=’utf8′, index_col=0)
df_ta_reviews.head()

df_ta_reviews.shape
(125527, 10)
df_ta_reviews.info()
<class 'pandas.core.frame.DataFrame'>
Index: 125527 entries, 0 to 1666
Data columns (total 10 columns):
 #   Column             Non-Null Count   Dtype
---  ------             --------------   -----
 0   Name               125527 non-null  object
 1   City               125527 non-null  object
 2   Cuisine Style      94176 non-null   object
 3   Ranking            115876 non-null  float64
 4   Rating             115897 non-null  float64
 5   Price Range        77672 non-null   object
 6   Number of Reviews  108183 non-null  float64
 7   Reviews            115911 non-null  object
 8   URL_TA             125527 non-null  object
 9   ID_TA              125527 non-null  object
dtypes: float64(3), object(7)
memory usage: 10.5+ MB
Let’s perform the following data wrangling:
- Fill NaN with zero
df_ta_reviews[‘Ranking’] = df_ta_reviews[‘Ranking’].astype(‘category’)
df_ta_reviews[‘Number of Reviews’] = df_ta_reviews[‘Number of Reviews’].fillna(0)
df_ta_reviews[‘Number of Reviews’] = df_ta_reviews[‘Number of Reviews’].round(0).astype(‘int’)
- Remove duplicates
print(df_ta_reviews[df_ta_reviews.ID_TA.duplicated() == True].ID_TA.count())
df_ta_reviews = df_ta_reviews.drop_duplicates(‘ID_TA’, keep=’first’)
df_ta_reviews.info()
201
<class 'pandas.core.frame.DataFrame'>
Index: 125326 entries, 0 to 1666
Data columns (total 10 columns):
 #   Column             Non-Null Count   Dtype
---  ------             --------------   -----
 0   Name               125326 non-null  object
 1   City               125326 non-null  object
 2   Cuisine Style      94047 non-null   object
 3   Ranking            115710 non-null  category
 4   Rating             115734 non-null  float64
 5   Price Range        77574 non-null   object
 6   Number of Reviews  125326 non-null  int32
 7   Reviews            115745 non-null  object
 8   URL_TA             125326 non-null  object
 9   ID_TA              125326 non-null  object
dtypes: category(1), float64(1), int32(1), object(7)
memory usage: 10.0+ MB
- Rename columns
df_ta_reviews.rename(columns={‘Name’: ‘name’,
‘City’: ‘city’,
‘Ranking’: ‘ranking’,
‘Rating’: ‘rating’,
‘Reviews’: ‘reviews’,
‘Cuisine Style’:’cuisine_style’,
‘Price Range’:’price_range’,
‘Number of Reviews’:’reviews_number’}, inplace=True)
- Fill negative ratings with zero
print(df_ta_reviews[df_ta_reviews.rating == -1.0].city.count())
df_ta_reviews.rating.replace(-1, 0, inplace=True)
41
- Create the data copy
ta_reviews = df_ta_reviews.copy()
- Count the unique restaurants and cities
rint(“Single Restaurants: {}”.format(ta_reviews.shape[0]))
print(“Cities: {}”.format(ta_reviews.city.nunique()))
Single Restaurants: 125326
Cities: 31
Basic Bar Plots
- Number of restaurants in each city
import matplotlib
matplotlib.rc(‘xtick’, labelsize=20)
matplotlib.rc(‘ytick’, labelsize=20)
fig = plt.figure(figsize=(20, 9))
ax = plt.subplot();
df_restaurants_in_cities = ta_reviews.groupby(‘city’).name.count().sort_values(ascending = False)
plt.bar(x = df_restaurants_in_cities.index, height=df_restaurants_in_cities, color=”#4ECDC4″);
plt.xticks(rotation=’vertical’);
plt.ylabel(‘Number of Restaurants’,fontsize=20);
ax.spines[‘right’].set_visible(False);
ax.spines[‘top’].set_visible(False);
ax.spines[‘left’].set_visible(False);
plt.title(‘Number of restaurants in each city’,fontsize=20);
ax.tick_params(direction=’out’, length=0, width=0, colors=’black’);
plt.grid(color = ‘black’, linestyle = ‘–‘, linewidth = 0.5)

- Number of reviews for each city
import matplotlib
matplotlib.rc(‘xtick’, labelsize=20)
matplotlib.rc(‘ytick’, labelsize=20)
df_reviews_count = ta_reviews.groupby(‘city’).reviews_number.sum().sort_values(ascending=False)
count_millions = np.arange(0, 2.14e6, 20e4)
count = np.arange(0, 2.6, 0.25)
fig = plt.figure(figsize=(20, 9))
ax = plt.subplot();
plt.bar(x = df_reviews_count.index, height=df_reviews_count, color=”#4ECDC4″);
plt.xticks(rotation=’vertical’);
plt.yticks(count_millions, count);
plt.ylabel(‘Total Number of Reviews (Millions)’,fontsize=20);
ax.spines[‘right’].set_visible(False);
ax.spines[‘top’].set_visible(False);
ax.spines[‘left’].set_visible(False);
plt.title(‘Number of reviews for each city’,fontsize=20);
ax.tick_params(direction=’out’, length=0, width=0, colors=’black’);
plt.grid(color = ‘black’, linestyle = ‘–‘, linewidth = 0.5)

- Average Number of reviews for each city
import matplotlib
matplotlib.rc(‘xtick’, labelsize=20)
matplotlib.rc(‘ytick’, labelsize=20)
tot_reviews_city = pd.DataFrame(ta_reviews.groupby(‘city’).reviews_number.sum())
tot_places_city = pd.DataFrame(ta_reviews.groupby(‘city’).name.count())
reviews_per_city = pd.merge(tot_reviews_city, tot_places_city, how=’outer’, on=’city’)
reviews_per_city.rename(columns={‘name’:’number_of_places’}, inplace=True)
reviews_per_city[‘avg_reviews’] = round(reviews_per_city.reviews_number / reviews_per_city.number_of_places, 2)
reviews_per_city.sort_values(by=’avg_reviews’, ascending=False, inplace=True)
fig = plt.figure(figsize=(20, 9))
ax = plt.subplot();
plt.bar(x = reviews_per_city.index, height=reviews_per_city.avg_reviews, color=”#4ECDC4″);
plt.xticks(rotation=’vertical’,fontsize=20);
ax.spines[‘right’].set_visible(False);
ax.spines[‘top’].set_visible(False);
ax.spines[‘left’].set_visible(False);
plt.title(‘Average Number of reviews for each city’,fontsize=20);
ax.tick_params(direction=’out’, length=0, width=0, colors=’black’);
plt.grid(color = ‘black’, linestyle = ‘–‘, linewidth = 0.5)

- Let’s create the new data frame
cuisines = ta_reviews.loc[:, [‘city’, ‘name’, ‘cuisine_style’, ‘rating’, ‘reviews_number’, ‘reviews’]]
cuisines.cuisine_style = cuisines.cuisine_style.str.replace(‘[‘, ”)
cuisines.cuisine_style = cuisines.cuisine_style.str.replace(‘]’, ”)
cuisines.columns = [‘city’, ‘place’, ‘cuisine_style’, ‘rating’, ‘reviews_number’, ‘reviews’]
all_cuisines = cuisines[cuisines.cuisine_style.isna() == False]
dic = []
for i in all_cuisines.iterrows():
for j in range(0, len(i[1].cuisine_style.split(', '))):
    dic.append({
        'city': i[1].city,
        'place': i[1].place,
        'cuisine_style': i[1].cuisine_style.split(', ')[j].replace('\'', ''),
        'rating': i[1].rating,
        'reviews_number': i[1].reviews_number
    })
cuisines_list = pd.DataFrame(data=dic)
cuisines_list.cuisine_style.nunique()
127
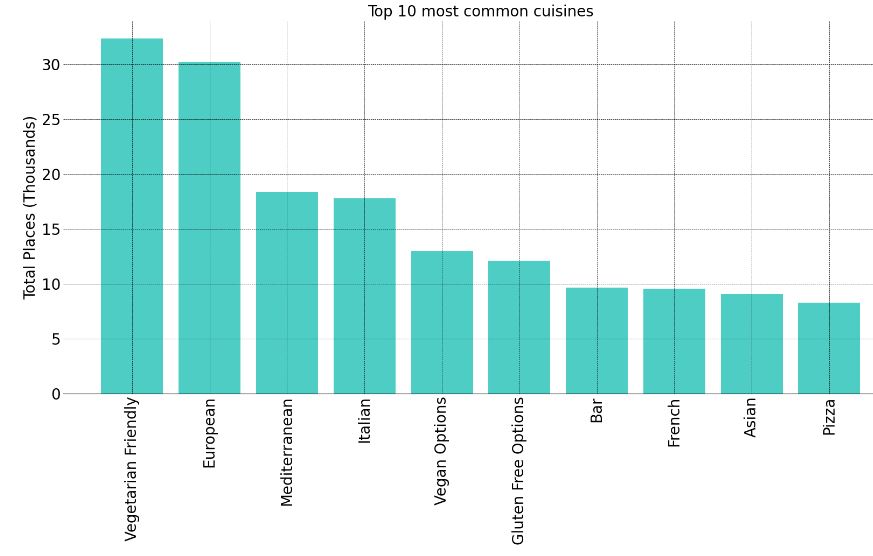
- Top 10 most common cuisines
import matplotlib
matplotlib.rc(‘xtick’, labelsize=20)
matplotlib.rc(‘ytick’, labelsize=20)
df_cuisine_style = cuisines_list.cuisine_style.value_counts().sort_values(ascending = False)[:10]
count_ths = np.arange(0, 3.3e4, 5e3)
count = np.arange(0, 35, 5)
fig = plt.figure(figsize=(20, 9))
ax = plt.subplot();
plt.bar(x = df_cuisine_style.index, height=df_cuisine_style, color=”#4ECDC4″);
plt.yticks(count_ths, count,fontsize=20);
plt.ylabel(‘Total Places (Thousands)’,fontsize=20);
ax.spines[‘right’].set_visible(False);
ax.spines[‘top’].set_visible(False);
ax.spines[‘left’].set_visible(False);
plt.title(‘Top 10 most common cuisines’,fontsize=20);
ax.tick_params(direction=’out’, length=0, width=0, colors=’black’);
plt.xticks(rotation=’vertical’,fontsize=20);
plt.grid(color = ‘black’, linestyle = ‘–‘, linewidth = 0.5)
- Top 10 most reviewed cuisines
df_cuisine_style = cuisines_list.groupby(‘cuisine_style’).reviews_number.sum().sort_values(ascending=False)[:10]
count_ths = np.arange(0, 9.3e6, 5e5)
count = np.arange(0, 9.3, 0.5)
fig = plt.figure(figsize=(20, 9))
ax = plt.subplot();
plt.bar(x = df_cuisine_style.index, height=df_cuisine_style, color=”#4ECDC4″);
plt.yticks(count_ths, count);
plt.ylabel(‘Total Reviews (Million)’,fontsize=20);
ax.spines[‘right’].set_visible(False);
ax.spines[‘top’].set_visible(False);
ax.spines[‘left’].set_visible(False);
plt.title(‘Top 10 most reviewed cuisines’,fontsize=20);
ax.tick_params(direction=’out’, length=0, width=0, colors=’black’);
plt.xticks(rotation=’vertical’,fontsize=20);

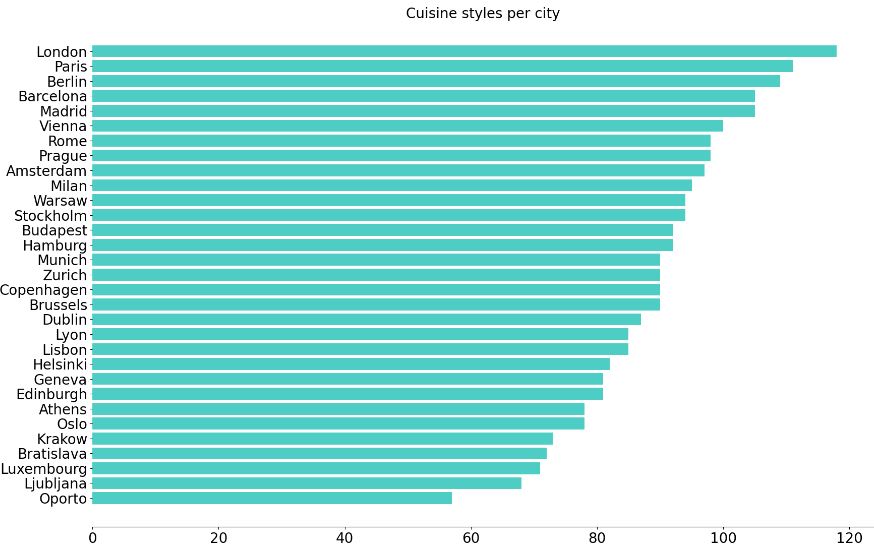
- Cuisine styles per city
import matplotlib
matplotlib.rc(‘xtick’, labelsize=20)
matplotlib.rc(‘ytick’, labelsize=20)
city_styles = cuisines_list.groupby([‘city’, ‘cuisine_style’]).rating.count().reset_index()
city_variety = city_styles.groupby(‘city’).cuisine_style.count().sort_values(ascending = False)
fig = plt.figure(figsize=(20, 13))
ax = plt.subplot();
ax.barh(city_variety.index[::-1],city_variety.values[::-1], align=’center’, color=”#4ECDC4″);
ax.spines[‘right’].set_visible(False);
ax.spines[‘top’].set_visible(False);
ax.spines[‘left’].set_visible(False);
plt.title(‘Cuisine styles per city’,fontsize=20);
Spatial Analytics
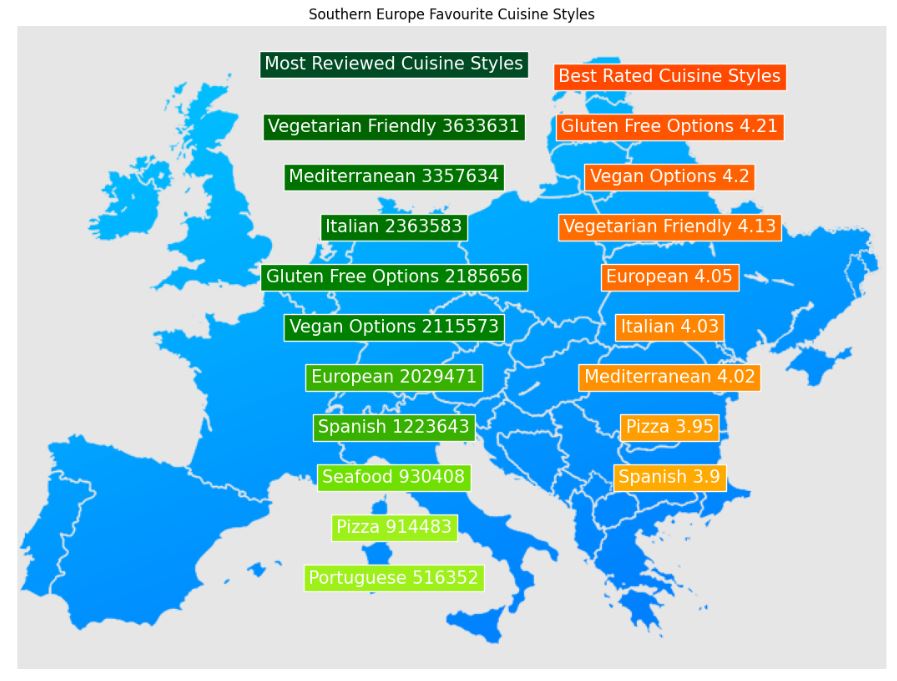
- Southern Europe Favourite Cuisine Styles
from matplotlib import cm
euro = np.array(Image.open(‘europeblue.png’))
grn = [‘#006400’, ‘#007200’, ‘#007200’, ‘#008000’, ‘#008000’,
‘#38b000’, ‘#38b000’, ‘#70e000’, ‘#9ef01a’, ‘#9ef01a’, ]
orng = [‘#FF5400’, ‘#FF6000’, ‘#FF6D00’, ‘#FF6D00’, ‘#FF8500’,
‘#FF9100’, ‘#FF9E00’, ‘#FFAA00’, ‘#FFB600’, ‘#FFB600’, ]
plt.figure(figsize = (18, 10), facecolor = None) ;
ax = plt.subplot();
plt.title(‘Southern Europe Favourite Cuisine Styles’)
plt.imshow(euro);
plt.text(
300, 30, ‘Most Reviewed Cuisine Styles’,
ha=”center”, va=”center”, rotation=0, size=15, color = “white”,
bbox=dict(boxstyle=”square,pad=0.3″, fc=’#004b23′, ec=”w”, lw=1));
top = 40
left = 0
stili = reviews_south.cuisine_style.to_list()
i = 0
for styl in stili:
styl_score = styl + ” ” + str(reviews_south[reviews_south.cuisine_style == styl].revs.item())
top = top + 40
plt.text(
300, top, styl_score, ha=”center”, va=”center”, rotation=0, size=15, color = “white”,
bbox=dict(boxstyle=”square,pad=0.3″, fc=grn[i], ec=”w”, lw=1))
i += 1
plt.text(
520, 40, ‘Best Rated Cuisine Styles’,
ha=”center”, va=”center”, rotation=0, size=15, color = “white”,
bbox=dict(boxstyle=”square,pad=0.3″, fc=’#ff4800′, ec=”w”, lw=1));
top = 40
left = 520
rating_1000 = rating_south[rating_south.rat_count >= 3000]
rating_1000 = rating_1000.sort_values(by=’rat_mean’, ascending = False)[:10]
stili = rating_1000.cuisine_style.to_list()
i = 0
for styl in stili:
styl_score = styl + ” ” + str(round(rating_1000[rating_1000.cuisine_style == styl].rat_mean.item(), 2))
top = top + 40
plt.text(
left, top, styl_score, ha=”center”, va=”center”, rotation=0, size=15, color = “white”,
bbox=dict(boxstyle=”square,pad=0.3″, fc=orng[i], ec=’w’, lw=1))
i += 1
ax.spines[‘right’].set_visible(False);
ax.spines[‘top’].set_visible(False);
ax.spines[‘left’].set_visible(False);
ax.spines[‘bottom’].set_visible(False);
ax.yaxis.set_visible(False);
ax.xaxis.set_visible(False);
- Folium map of European cities
import folium
import base64
from folium import IFrame
def get_flag(city):
flag = map_cities.get(city)
flag_url = flag[‘flag’]
return(flag_url)
def get_top_options2(city):
opt = top_options[top_options.index.get_level_values(‘city’).isin([city])][:3]
opt = opt.reset_index()
opt = opt.sort_values(by=[“rating”, “reviews_number”], ascending=[False, False])
top_3 = “”
icon_class = “”
for i in opt.iterrows():
if (i[1][‘cuisine_style’] == “Gluten Free Options”) or (i[1][‘cuisine_style’] == “Vegan Options”):
icon_class = “fa-pagelines”
elif i[1][‘cuisine_style’] == “Vegetarian Friendly”:
icon_class = “fa-tree”
else:
icon_class = “fa-globe”
top_3 += “
” + i[1][‘cuisine_style’] + ” ” + str(i[1][‘rating’]) + ” (” + str(i[1][‘reviews_number’]) + ” reviews)”
return(top_3)
europe = folium.Map(
location=[52.4214, 8.3750],
tiles = “OpenStreetMap”,
zoom_start=4
)
for k, v in map_cities.items():
flag = get_flag(k)
html = “” html += “
{}
{}
“.format(k, flag, get_top_options2(k)) html += “”
iframe = folium.IFrame(html, width=(300)+20, height=(110)+20)
popup = folium.Popup(iframe, max_width=1000)
folium.Marker(location =[v['lat'], v['lon']],
            popup=popup,
            icon = folium.Icon(color='darkpurple', icon='fa-cutlery', prefix='fa')
).add_to(europe)
europe

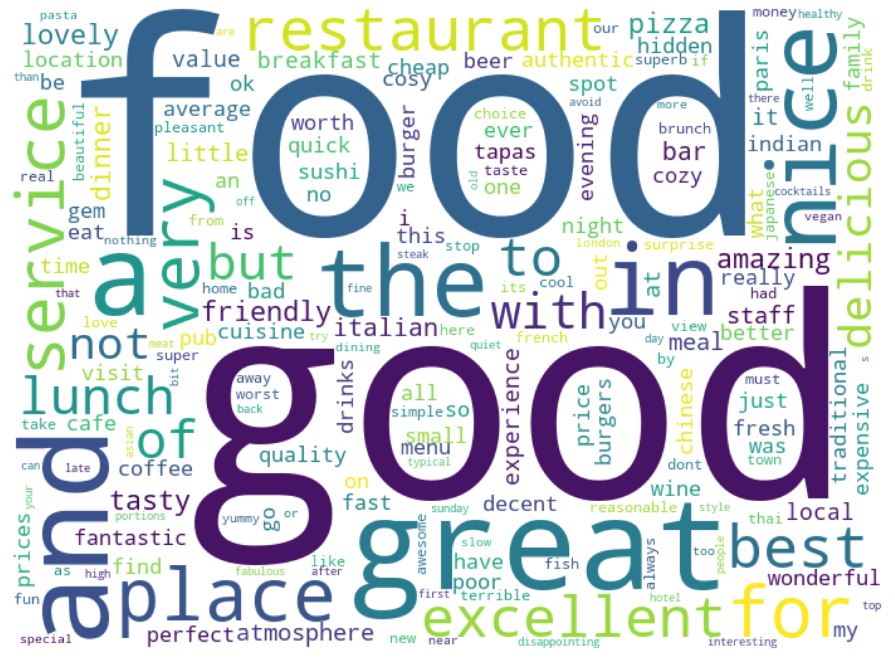
Word Clouds
words_cuisines = cuisines.copy()
words_cuisines[(words_cuisines.reviews.isna()) | (words_cuisines.reviews == ‘[[], []]’)].info()
<class 'pandas.core.frame.DataFrame'>
Index: 28622 entries, 1361 to 1666
Data columns (total 6 columns):
 #   Column          Non-Null Count  Dtype
---  ------          --------------  -----
 0   city            28622 non-null  object
 1   place           28622 non-null  object
 2   cuisine_style   14754 non-null  object
 3   rating          19036 non-null  float64
 4   reviews_number  28622 non-null  int32
 5   reviews         19041 non-null  object
dtypes: float64(1), int32(1), object(4)
memory usage: 1.4+ MB
all_revs = []
nan = 0
for ind, rev in words_cuisines[‘reviews’].items():
if type(rev) != float:
# the string is in a format [[reviews separated by comma], [review dates separated by comma]]
# in order to only keep the reviews, i split by ‘], [‘
g = rev.split(‘], [‘)
# and remove the first two chars at the beginning
g = g[0][2:].replace(‘\”, “”)
else:
g = “”
nan +=1
all_revs.append(g)
words_cuisines[‘reviews_only’] = all_revs
words_cuisines = words_cuisines.drop(‘reviews’, axis = 1)
from wordcloud import WordCloud, STOPWORDS
stopwords = set(STOPWORDS)
def words_cloud(words_list):
all_words = ”
#looping through all incidents and joining them to one text, to extract most common words
for ind, wrds in words_list.iteritems():
tokens = wrds.split()
all_words += ” “.join(tokens) + ” “
return all_words
def words_freq(items):
all_words = []
for i, item in items.items():
item = item.lower()
item = re.sub(“[^a-zA-Z]”, ” “, item)
#keep numbers
item = re.sub(“[^a-zA-Z0-9\s]+”, ” “, item)
all_words += item.split()
words = Counter(all_words)
return words
cloudmask = np.array(Image.open(‘europe_black.png’))
cloudmask = np.array(euro)
words = words_freq(words_cuisines[‘reviews_only’])
wordcloud = WordCloud(width = 1000, height = 700,
stopwords = stopwords, mask = cloudmask,
collocations = False,
background_color =’white’,
min_font_size = 6).generate_from_frequencies(words)
plt.figure(figsize = (20, 9), facecolor = None)
plt.imshow(wordcloud)
plt.axis(“off”)
plt.tight_layout(pad = 0)
plt.show()
Summary
- Food has been viewed as one of the noteworthy features influencing customer satisfaction in restaurant evaluations.
- Data and analytics are valuable for increasing revenue and improving operations.
- We utilize data to tailor marketing, optimize pricing and menu offerings, and make informed operational changes.
- In this study, we used the TripAdvisor Restaurants Info for 31 Euro-Cities from Kaggle.
- Online restaurant reviews retrieved from TripAdvisor have been analyzed by using domain-specific aspect-based sentiment detection and NLP visualization.
- The influence of different restaurant features on the overall evaluation of visitors and locals has been determined and the most critical factors are identified by the frequency of their online discussion.
- As it can clearly be seen, there is a difference in average ratings by city.
- There are also great differences in average number of restaurants with vegetarian/vegan option available.
- Local foods and meals provided by restaurants have been recognized a critical part of customer satisfaction.
Explore More
- Eating out in Europe
- A Shamelessly Simple E-Restaurant Order
- Semantic Analysis and NLP Visualizations of Wine Reviews
- ML/AI Prediction of Wine Quality
- SARIMAX-TSA Forecasting, QC and Visualization of E-Commerce Food Delivery Sales
- Trending YouTube Video Data Science, NLP Predictions & Sentiment Analysis


Make a one-time donation
Make a monthly donation
Make a yearly donation
Choose an amount
Or enter a custom amount
Your contribution is appreciated.
Your contribution is appreciated.
Your contribution is appreciated.
DonateDonate monthlyDonate yearly
Leave a comment