
Featured Photo by Andy Kelly on Unsplash
This blog presents a Q3 ’22 summary of current healthtech ML/AI innovation methods, trends and challenges. Virtual reality, artificial intelligence, augmented reality, and machine learning are all healthcare technology trends that are going to play a vital role across the entire healthcare system. Let’s take a look at several useful examples related to healthcare diagnostics, pharma technology, and prediction of surgical volumes.
Contents:
- Breast Cancer
- Heart Failure
- Diabetes-2
- Skin Cancer
- Stroke
- Drug Recommendation
- Drag Reviews
- Surgical Volumes
- Explore More
Breast Cancer
Recently, ML techniques have been successfully applied to the Breast Cancer Diagnosis (BCD) by providing an unprecedented opportunity to derive clinical insights from large-scale analysis of patient data. The most basic application of ML/AI in BCD is the binary classification problem. Classification usually refers to any kind of problem where a specific type of class label is the result to be predicted from the given input field of data. This is a task which assigns a label value (“benign” or “malignant”) to a specific class and then can identify a particular type to be of one kind or another. Generally, one is considered as the normal state and the other is considered to be the abnormal state. In BCD, ” No cancer detected” is a normal state and ” Cancer detected” represents the abnormal state.
The dataset used in this story is publicly available and was created by Dr. William H. Wolberg, physician at the University Of Wisconsin Hospital at Madison, Wisconsin, USA. The main steps of this project are as follows: input data preparation, editing and splitting, Exploratory Data Analysis (EDA), model training, testing, tuning, deployment, validation and inference. There are no missing or null data points of the data set.
We have tried several types of classification ML algorithms:
1 Linear regression
2 SVM 97.2%
3 Naive Bayes 91.6% (worst)
4 Random Forest 98.6% (best)
The above algorithms yield an acceptable accuracy above 91%.
We can compute the key confusion matrix metrics:
P=0.98 (0.96)
R=0.88 (0.96)
Hence, the F1-score is
F1 = 0.92 (0.96) = 0.94 +/- 0.02.
We can see that our model is working very efficiently and accurately in classifying whether the breast cancer is of malignant type or benign type. In addition to scikit-learn, we have visualized the data using pandas and matplotlib libraries.
Heart Failure
The complex nature of heart failure (HF) produces a significant amount of information that is too difficult for clinicians to process as it requires simultaneous consideration of multiple factors and their interactions. ML/AI techniques can be utilized in this scenario to develop a reliable decision support system to assist clinicians in properly interpreting the patients’ records to make informed decisions.
The Python-3 ML/AI workflow consists of the following steps:
- Install/import key libraries
- Download and QC the input HF dataset
- Exploratory Data Analysis (EDA)
- Feature Selection via Correlations
- Train-Test Data Split and Modeling/Prediction
- Performance Evaluation and Accuracy QC
- Confusion Matrix and Key Metrics QC
- Output Classification Report.
Accuracy of Logistic Regression is :  90.00%
Accuracy of SVC is :  90.00%
Accuracy of K Neighbors Classifier is :  91.67%
Accuracy of Decision Tree Classifier is :  90.00%
Accuracy of Random Forest Classifier is :  90.00%
Accuracy of Gradient Boosting is :  93.33%
Accuracy of XGBRFClassifier is :  93.33%
Accuracy of LGBMClassifier is :  86.67%
Accuracy of CatBoostClassifier is :  91.67%
It appears that both GB and XGBRF algorithm yield the highest accuracy of 93.3%.
Diabetes-2
About one in seven U.S. adults has diabetes now, according to the Centers for Disease Control and Prevention. But by 2050, that rate could skyrocket to as many as one in three. The objective of this study is to build a Machine Learning (ML) classifier model based on medical diagnostic measurements. This is a classic supervised binary classification problem.
The diabetes-2 data set PIDD was originated from UCI Machine Learning Repository and can be downloaded from here. The dataset is imbalanced in that the number of patients who are diabetic is half of the patients who are non-diabetic.
Let’s look at the list of column names
diabetes_df.columns
Index(['Pregnancies', 'Glucose', 'BloodPressure', 'SkinThickness', 'Insulin',
       'BMI', 'DiabetesPedigreeFunction', 'Age', 'Outcome'],
      dtype='object').
We replace NaNs with mean values and perform data scaling using StandardScaler(). We split the data into the training and test datasets with test_size=0.33.
After using all these patient records, we are able to build a machine learning model (Random Forest – best one) to accurately predict whether or not the patients in the dataset have diabetes or not along with that we were able to draw some insights from the data via data analysis and visualization. The RandomForestClassifier(n_estimators=200) classification report is as follows:
Confusion matrix = [[139 23] [ 32 60]]
precision recall f1-score support
0 0.81 0.86 0.83 162
1 0.72 0.65 0.69 92
The feature dominance analysis has shown that Glucose as a feature is the most important in this dataset.
Skin Cancer
Skin cancer is one of the most active types of cancer in the present decade.
Melanoma, the most serious type of skin cancer, can only be cured if diagnosed early; otherwise, they spread to other body parts and lead to the victim’s painful death. Therefore, the critical factor in skin cancer treatment is early diagnosis.
Yet, diagnoses is still a visual process, which relies on the long-winded procedure of clinical screenings, followed by dermoscopic analysis, and then a biopsy and finally a histopathological examination. This process easily takes months and the need for many medical professionals and still is only ~77% accurate.
Current methods using AI and Deep Learning to diagnose lesions show potential to spare time and mitigate errors- saving millions of lives in the long run.
Using TensorFlow library in Python, we can implement an image recognition skin disease classifier that tries to distinguish between benign (nevus and seborrheic keratosis) and malignant (melanoma) skin diseases from only photographic 2D RGB images, as shown here.
The key steps of the Python workflow are as follows:
Installing and Importing Essential Libraries
Reading and Processing Data – a small part of ISIC archive dataset
Building and Evaluating the Model
Results:
The sensitivity (i.e. the probability of a positive test given that the patient has the desease) is 67%, whereas the specificity (i.e. the probability of a negative test given that the patient is well) is 63% for the threshold=0.23.  The Area Under Curve ROC (ROC AUC) is 0.66 an area of 1 means the ideal model.
Future:
We can improve the model by increasing the number of training samples. We can also tweak the hyperparameters such as the threshold we set earlier, and see if we can get better sensitivity and specificity scores.
Stroke
According to the World Health Organization (WHO) stroke is the 2nd leading cause of death globally after ischemic heart disease, responsible for approximately 11% of total deaths.
In this case study, we formulate the ML stroke prediction process as a binary classification problem and provide a detailed understanding of the various risk factors for stroke prediction. Specifically, we analyse various features present in Electronic Health Record (EHR) records of patients, and identify the most important factors necessary for stroke prediction. In doing so, we use dimensionality reduction techniques to identify patterns in low-dimension subspace of the feature space. We benchmark popular ML/AI binary classification models for stroke prediction in a publicly available dataset.
The actual ML workflow boils down to the following sequence:
- Install the Anaconda IDE with the Jupyter notebook and Python 3.9.
- Install and import the required Python ML libraries.
- Read input EMR Kaggle dataset healthcare-dataset-stroke-data.csv
- Input data preparation, editing, transformation and visualization
- Feature engineering, correlations and impact factors
- Train/test data splitting (test_size=0.25) and SMOTE balancing
- Binary classification model training, ML benchmarking, testing and X-validation
- Scikit-Plot: Visualizing ML Algorithm Results & Performance
- Output the final classification report, the best training model and predictions.
Let’s summarize our best prediction classification results with XGBClassifier
Accuracy –> 0.9117889530090684
F1 Score –> 0.9066317626527051
Classification Report –>
precision recall f1-score support
0 0.97 0.87 0.92 1347
1 0.86 0.96 0.91 1079
accuracy 0.91 2426
macro avg 0.91 0.92 0.91 2426
weighted avg 0.92 0.91 0.91 2426
skplt.metrics.plot_confusion_matrix(test_y, predict, normalize=True)
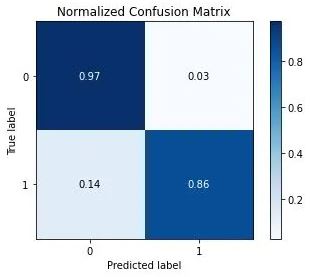
In this example, the best trained XGB or GradientBoosting Classifier on the SMOTE-balanced stroke dataset can predict a patient stroke with accuracy=91%, precision = 97%, recall = 96% and f1-score=90%. The summary outcome of our performance QC analysis is as follows:
- learning curves
- average score ~0.4 +/- 0.08 and 0.02 for validation and training data, respectively
- ROC curve area = 0.97
- Precision-recall curve area = 0.963, 0.97 of class 0, 1
- Silhouette score = 0.352
- Calibration plot confirms that the GradientBoosting is the best Classifier
- KS statistic 0.607 at 0.437
- Cumulate gains curve is max 60% deviates from baseline at 50% samples
- Lift is ~ 1.55 at 50% samples
- Elbow plot – the optimal number of clusters is 6
- PCA analysis – 0.872 explained variance ratio for first 1 components
- PCA 2-D projection – we can see the data is non-linear and also some interesting clustering. This suggests a high-dimension classification model or clustering model did work nicely.
Drug Recommendation
Leading biopharmaceutical companies’ belief in AI is due to growing awareness related to AI in the pharmaceutical sector and rising investment in drug development.
The objective of this project is to to build an AI-guided drug review system that recommends the most effective drug for a certain condition based on available reviews of various drugs used to treat this condition.
Workflow:
- Setup Jupyter notebook within the Anaconda IDE
- Import/install relevant Python libraries
- Download the Kaggle UCI ML Drug Review dataset
- Overview of the train/test dataset
- Reset the index after data concatenation
- Exploratory Data Analysis (EDA) using SNS plots
- Plot the WordCount images for positive/negative reviews
- Loading stop words from NLTK
- Text data NLP Pre-Processing (removing digits, extra spaces, lower case, etc.)
- nltk.sentiment.vader sentiment analysis using SentimentIntensityAnalyzer
- Adding the sentiment scores for reviews, preprocessed reviews as new features
- Feature Engineering – check the Pearson correlation matrix of various features
- Adding the word count, stopword count,char length, unique words count, mean word length, and puncation count
- Named entity recognition (NER) using spacy
- LDA topic modelling – prepare cleaned reviews
- Splitting the data into train, test and cross-validation (CV) datasets
- Encoding categorical, text and numerical features by applying LabelEncoder
- Vectorizing the cleaned reviews using BoW, TF-IDF (1 gram)
- Word2Vec Vectorization for reviews using pretrained glove model
- Compute the LDA confusion, precision, and recall matrices for the test data
Following recent ML and DA studies, we have addressed the problem of building an NLP-based drug recommendation system in Python. It appears that the Sentiment Analysis, Topic Modelling and Word2Vec techniques play a major role in classifying the drug reviews thereby recommending the effective drugs.
The simplest way to deploy our trained LDA model is to create a web service using the Flask web framework. A final web app can be deployed within the multi-cloud environment discussed here.
Drag Reviews
A medication recommender framework is truly vital with the goal that it can assist specialists and help patients to build their knowledge of drugs on specific health conditions.
Objective: Build a Drug Recommendation System that recommends the most effective drug for a certain condition based on available reviews of various drugs used to treat this condition.
The Kaggle UCI ML Drug Review dataset provides over 200000 patient reviews on specific drugs along with related conditions and a 10-star patient rating system reflecting overall patient satisfaction.
The input dataset contains 7 columns: uniqueID, drugName, condition, review, rating, date, and usefulCount.
Workflow:
- Importing relevant libraries
- Reading input raw data
- Check data content/statistics
- Plotting top 10 conditions
- Drug count for each condition
- Top 10 drugs used for the top condition
- Plotting the top 10 drugs rated as 1 or 10
- Plotting the percentage distribution of ratings using pie chart
- Checking the distribution of usefulCount feature
- Data analytics report summary
Summary
- The categorical feature condition has 0.55% missing values to be dropped.
- Birth Control is the topmost condition followed by Depression, Pain, and Anxiety.
- Patients use several drugs to treat their conditions.
- Pain and Birth Control conditions have the highest drug count.
- Top drugs used for Birth Control are Etonogestrel Ethinyl Estradiol, Levonorgestrel and Nexplanon.
- Birth Control and Weight Loss/Obesity drugs are top rated.
- Etonogestrel and Levonorgestrel should be the top 2 recommended drugs as they are mostly frequently used and also rated as 10.
- It appears that ~75% of drugs are rated with 10,9,8 and 1 ratings.
- The maximum number of drug reviews is less than 200 upvotes.
Surgical Volumes
Operating rooms (ORs) are some of the most valuable hospital assets, generating a large part of hospital revenue. For efficient utilization of ORs, accurate schedules of assigned block time and sequences of patient cases need to be made. Statistical models such as ANOVA-OLS have been developed using datasets to predict daily surgical volumes weeks in advance.
In this study, we focus on the VUMC dataset for evaluation of our statistical models. The dataset represents a 48-week surgery schedule for VUMC recorded from October 10, 2011 to September 14, 2012.
Our method consists of the ANOVA null-hypothesis test for the total number of surgeries to see if these variables change from day to day with 99% confidence. The null hypothesis H0 is the statement that the total number of surgeries does not depend upon the weekday (DOW). The alternative hypothesis states that the total number of surgeries does vary from day to day.
Next, the Ordinary Least Squares (OLS) linear regression formula is applied to our target variable Actual Surgery as a function of 28 independent variables, T-28 to T-1.
The OLS regression results are assessed using the following metrics: (adjusted) R2, F-statistic, Log-Likelihood, AIC, BIC, std err, MSE, MAE, and RMSE.
Workflow:
- Import/install libraries
- Read the input dataset
- Exploratory Data Analysis (EDA)
- ANOVA H0-H1 test
- Build OLS regression model
- Model performance QC
- Report summary
Summary:
- Our input data have 4 outliers (11/25/2011, 12/23/2011, 12/26/2011, and 12/30/2011).
- Our data analysis shows that Fridays/Thursdays have the lowest/highest number of surgeris.
- The surgery volume correlation value between DOW and the actual Surgery Date (SD) decreases as the gap between DOW and SD increases.
- The ANOVE test rejects our null hypothesis H0 with 99% confidence.
- Our results are statistically significant since p<<0.05.
- We have performed multiple pairwise comparison (Tukey HSD) test to confirm the acceptance of our H1 hypothesis.
- Predicting surgery volumes for 7 days before the Surgery Date yields the best result, as shown below:
| Metric | Base Model | 3 Days Forecast | 7 Days Forecast |
| MAE | 14.95 | 14.69 | 13.56 |
| MSE | 426.57 | 414.83 | 375.60 |
| RMSE | 20.65 | 20.36 | 19.38 |
| R2 | -0.35 | -0.31 | -0.19 |
Explore More
Supervised ML/AI Breast Cancer Diagnostics – The Power of HealthTech
Supervised ML/AI Breast Cancer Diagnostics (BCD) – The Power of HealthTech
Python Use-Case Supervised ML/AI in Breast Cancer (BC) Classification
Heart Failure Prediction using Supervised ML/AI Technique
ML/AI Image Classifier for Skin Cancer Detection
AI-Driven Skin Cancer Diagnosis
ANOVA-OLS Prediction of Surgical Volumes
The Application of ML/AI in Diabetes
Diabetes Prediction using ML/AI in Python
Heart Failure Prediction using Supervised ML/AI Technique


Make a one-time donation
Make a monthly donation
Make a yearly donation
Choose an amount
Or enter a custom amount
Your contribution is appreciated.
Your contribution is appreciated.
Your contribution is appreciated.

Leave a comment