
Contents:
- Overview
- Features
- Maps
- Free Tools
- Equities
- Portfolios
- Options
- Crypto
- Stories
- Watch Out For Price Decline
- Use Technical Analysis To Project Acura Expected Price
- How Does Acura Utilize Its Cash?
- Detailed Outlook On Acura Pharma
- Deferred Revenue Breakdown
- Acura Pharma Latest Price Fall Can Leaving Retail Investors With Little Time To React
- The Current Takeaway On Acura Pharma Investment
- Pilot
- Use-Case 1: Optimized Artificial Intelligence
- Suggested Asset Allocation And Market Analysis
- Technical Analysis Of Total Daily Returns
- Correlation Matchups
- Risk-Adjusted Indicators
Overview
What is Macroaxis?
Investment management solution that helps businesses create and manage portfolios, capital through financial analysis tools.
Best For
Designed for small businesses, it is an investment management solution that helps with portfolio creation, asset allocation, and more using various financial models.
Pricing
Macroaxis pricing starts at $19.99 per month. There is a free version. Macroaxis does not offer a free trial.
1-50 users
Designed for small businesses, it is an investment management solution that helps with portfolio creation, asset allocation, and more using various financial models.
Features
- Benchmarking
- Bonds / Stocks
- For Investment Advisors
- For Investors & Traders
- Modeling & Simulation
- Performance Metrics
- Portfolio Rebalancing
- Risk Management
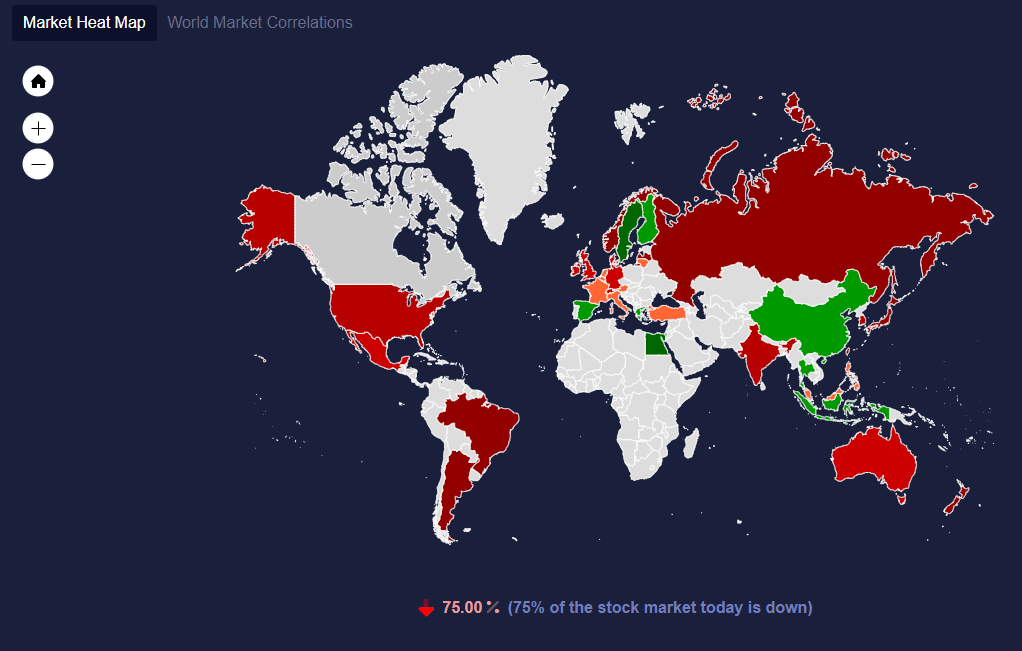
Maps
Current markets are strongly bearish. About 75% of major world exchanges and indexes are down. The Macroaxis Market Sentiment shows the average consensus about the current global stock market drawing from a sample of 30 major word indexes outlined below.
Free Tools
- Correlation Analysis
- Risk-Return Analysis
- Performance Analysis
- Content Syndication
- Insider Screener
- Stock Screener
- Alpha Finder
- Options Analysis
- Bond Analysis
- Premium Stories
- Equity Valuation
- Fundamental Analysis
- Technical Analysis
- Probability of Bankruptcy
- Piotroski F Score
- Volatility Analysis
- Focused Opportunities
- Idea Optimizer
- Idea Breakdown
- My Watchlist Analysis
- Earnings Calls
- Theme Ratings
- Global Markets Maps
- Pair Correlation
- Competition analyzer
- Analyst Recommendation
- Headlines Timeline
- Idea Analyzer
- Fundamentals Comparison
- Cryptocurrency Center
- Companies Directory
- Equity Analysis
- Financial Widgets
- Global Correlations
- Stock Tickers
- Equity Search
- ETF Directory
- Bond Directory
- Money Flow Index
- Aroon Oscillator
- Commodity Channel Index
- Price Exposure Probability
- Bollinger Bands
- Crypto Correlations
Equities
Portfolios
Over the last 30 years portfolio optimization including different implementations of Modern Portfolio Theory (MPT) became a trusted methodology for many professional money managers and financial advisors to establish a disciplined approach to building wealth for their clients. With the advancement in technology and availability of computing power to perform very intensive mathematical calculations, the paradigm of mean-variance optimization can now be brought to new generation of investors significantly reducing the cost of delivery of advanced financial analytics. As an investor, your ultimate goal is to build wealth. Optimizing your investment portfolio is an essential element in this goal. However, portfolio optimization doesn’t happen overnight. It is a process that takes both time and strategic planning. Investing will always carry a degree of risk. However, portfolio optimization helps to lessen this risk by setting you up to make sound investment decisions. These strategic investment decisions will allow you to create an efficient investment portfolio over time.
What Is Portfolio Optimization?
The objective of portfolio optimization is to build an investment portfolio that yields the maximum possible return while also reducing the total amount of risk involved. Implementing portfolio optimization strategies will leave you with a balanced portfolio where your investment capital is spread across various asset classes. Investors call this an efficient portfolio, but what does an efficient portfolio really look like?An efficient investment portfolio is based on the concept of diversification. Ultimately, diversification across classes is a risk-mitigation strategy. To plan for systemic risk, an efficient portfolio will include a wide variety of asset types and classes. Ideally, investors spread their asset classes over Stocks, Bonds, Debt instruments,Funds,Commodities, ETFs, Cash, and Cryptocurrency.Having a diversified investment portfolio that consists of these various types of asset classes helps to create an optimized investment portfolio. Investing in diversified asset classes helps your portfolio continue to perform as the market at large fluctuates. For example, when the stock market is performing well, commodities and bonds tend to perform poorly. Conversely, when stock prices fall, commodities and bonds rise in value. This is why having a diversified investment portfolio is so important for yielding high returns, while also safeguarding your portfolio against investment risk. However, having a diversified investment portfolio is just the beginning when it comes to portfolio optimization. You must also put time and research into building diversification within each asset class. Of the various asset classes, your stock portfolio will require the most diversification when it comes to optimization. So, how do you optimize your portfolio?
Creating An Optimized Portfolio
Generally speaking, portfolio optimization refers to a statistical approach to making optimal investment decisions across different financial instruments. When it comes to building your stock portfolio, you never want to put all your eggs into one basket. The stock market is volatile, as you can never be certain of what the market will do at any given moment. This is why you must diversify your stock holdings by owning stocks from a variety of different sectors or industries.Implementing sector diversification when investing in stocks lowers your overall risk and equips your portfolio and generate smooth returns over time. This approach typically involves rebalancing portfolios to achieve the most efficient mix of instruments based on a trade-off between risk and expected return. So, what are the various stock market sectors that you should invest in? The Global Industry Classification Standard or GICS is the primary financial industry standard for defining sector classifications. The GICS breaks the stock market down into 11 sectors, 24 industry groups, 68 industries, and 157 sub-industries. The Macroaxis wealth optimization framework is designed to model the process of effective portfolio origination that, if properly applied, can lead to a significant reduction of systematic risk while achieving way above-average risk-adjusted returns over a long period.
Options
Macroaxis helps investors of all levels and skills to maximize the upside of all their holdings and minimize the risk associated with market volatility, economic swings, and company-specific events
Crypto
Use our cryptocurrency optimization module to reduce some of your inherited risks by holding a diversified portfolio of volatile digital assets or mixing digital assets with more traditional equity instruments such as stocks, funds, and ETFs. Please also try our Cryptocurrency Correlations module, or start creating your first, fully optimized, cryptocurrency portfolio.Currently, investing in cryptocurrency is on every investor’s radar and it is taking over the digital world. When the first crypto was introduced, backed by blockchain technology, no one believed in the fad. More than a decade later, the crypto market has emerged as one of the best investment areas.People who bought cryptocurrency around 2017 are reaping the gains of the investment decision of their lives. However, it’s crucial to keep in mind that the crypto market is tremendously volatile. The prices will rise and fall randomly. You’ll have to make an informed decision on the amount of liquid funds to allocate to cryptocurrency. You should make sure you have enough funds to run for at least six months without debts. You ought to be wary of investing more than 10% or 5% of your income. Cryptocurrency investment depends entirely on its price increasing significantly, and significant risks are involved.You should choose the ideal platform where you can buy, sell or hold your crypto assets. Cryptocurrency is usually decentralized. There’s no central authority that runs the currency. These cryptocurrency exchange platforms are designed to manage cryptocurrencies and their volatile nature. While picking your ultimate exchange platform, be sure to compare transaction fees, pros, and cons.
Stories
The latest story will sum up Acura Pharma. We will look into a few reasons why it is still possible for the company to generate above-average margins and positive cash flow. Acura Pharma Cmn is presently traded for 0.51. The entity stock is not elastic to its hype. The immediate return on the next news is anticipated to be very small, whereas the daily expected return is presently at 0.13%. The volatility of relative hype elasticity to Acura Pharma is about 98142.86%. Given the investment horizon of 90 days the next anticipated announcement will be very soon.
Continue To Hold Acura Pharma (OTC:ACUR)?
The asset utilization indicator refers to the revenue earned for every dollar of assets a company currently reports. Acura Pharma has an asset utilization ratio of 13.27 percent. This connotes that the company is making $0.13 for each dollar of assets. An increasing asset utilization means that Acura Pharma Cmn is more efficient with each dollar of assets it utilizes for everyday operations.
The successful prediction of Acura Pharma stock price could yield a significant profit to investors. But is it possible? The efficient-market hypothesis suggests that all published stock prices of traded companies, such as Acura Pharma Cmn, already reflect all publicly available information. This academic statement is a fundamental principle of many financial and investing theories used today. However, the typical investor usually disagrees with a ‘textbook’ version of this hypothesis and continually tries to find mispriced stocks to increase returns. We use internally-developed statistical techniques to arrive at the intrinsic value of Acura Pharma based on Acura Pharma hews, social hype, general headline patterns, and widely used predictive technical indicators.We also calculate exposure to Acura Pharma’s market risk, different technical and fundamental indicators, relevant financial multiples and ratios, and then comparing them to Acura Pharma’s related companies.
Watch Out For Price Decline
Please consider monitoring Acura Pharma on a daily basis if you are holding a position in it. Acura Pharma is trading at a penny-stock level, and the possibility of delisting is much higher compared to other equities. However, just because the otc stock is trading under one dollar, does not mean it will be marked for deletion. Most exchanges require public instruments, such as Acura Pharma stock to be traded above the $1 level to remain listed. If Acura Pharma stock price falls below $1 for 30 consecutive trading days, the exchange can delist it. Once the company reaches this point, they will be sent an initial price violation notice directly from an exchange.
Use Technical Analysis To Project Acura Expected Price
Acura Pharma technical otc stock analysis exercises models and trading practices based on price and volume transformations, such as the moving averages, relative strength index, regressions, price and return correlations, business cycles, stock market cycles, or different charting patterns.
How Does Acura Utilize Its Cash?
To perform a cash flow analysis of Acura Pharma, investors first need to understand how to read the cash flow statement. A cash flow statement shows the amount of cash Acura Pharma is receiving and how much cash it distributes out in a given period. The Acura Pharma cash flow statement breaks down these inflows and outflows into different buckets, including operating activities, investing activities, and financing activities.Acura Pharma Net Cash Flow from Operations is relatively stable at the moment as compared to the past year. Acura Pharma reported last year Net Cash Flow from Operations of (647,100)
Detailed Outlook On Acura Pharma
Acura Pharma Cmn reported the previous year’s revenue of 2.25 M. Net Loss for the year was (1.15 M) with profit before overhead, payroll, taxes, and interest of 1.79 M.
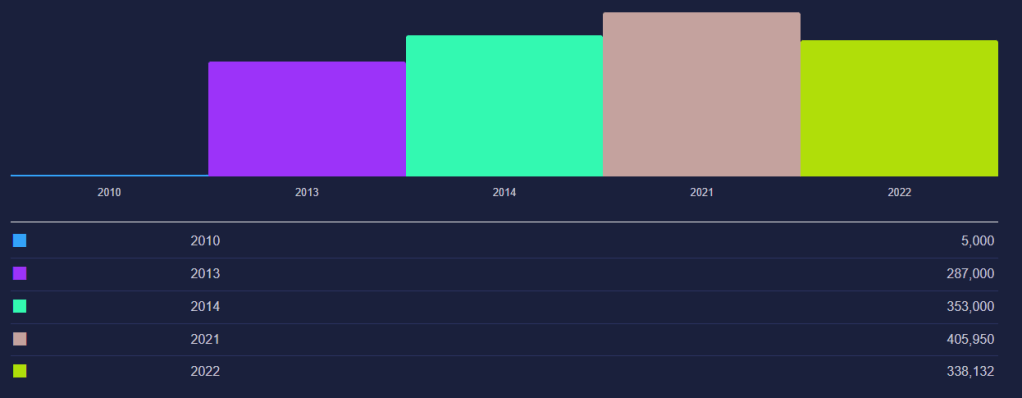
Deferred Revenue Breakdown
Acura Pharma Deferred Revenue yearly trend continues to be relatively stable with very little volatility. Deferred Revenue is likely to drop to about 338.1 K. Deferred Revenue usually refers to a component of Total Liabilities representing the carrying amount of consideration received or receivable on potential earnings that were not recognized as revenue; including sales; license fees; and royalties; but excluding interest income. Acura Pharma Deferred Revenue is relatively stable at the moment as compared to the past year. Acura Pharma reported last year Deferred Revenue of 405,950
Acura Pharma Latest Price Fall Can Leaving Retail Investors With Little Time To React
Latest maximum drawdown is at 37.02. Acura Pharma Cmn is displaying above-average volatility over the selected time horizon. Investors should scrutinize Acura Pharma Cmn independently to ensure intended market timing strategies are aligned with expectations about Acura Pharma volatility. Acura Pharma Cmn is a potential penny stock. Although Acura Pharma may be in fact a good instrument to invest, many penny otc stocks are speculative in nature and are subject to artificial price hype. Please make sure you totally understand the upside potential and downside risk of investing in Acura Pharma Cmn. We encourage investors to look for the signals such us email spams, message board hypes, claims of breakthroughs, volume upswings, sudden news releases, promotions that are not reported, or demotions released before SEC filings. Please also check biographies and work history of current and past company officers before investing in high volatility instruments, penny stocks, or equities with microcap classification. You can indeed make money on Acura instrument if you perfectly time your entry and exit. However, remember that penny stocks that have been the subject of an artificial hype usually unable to maintain its increased share price for more than just a few days. The price of a promoted high volatility instrument will almost always revert back. The only way to increase shareholder value is through legitimate performance backed up by solid fundamentals.
The Current Takeaway On Acura Pharma Investment
While some firms in the drug manufacturers—specialty & generic industry are either recovering or due for a correction, Acura Pharma may not be performing as strong as the other in terms of long-term growth potentials. While some retail investors may not share our view we believe that the current risk-reward utility is not appealing enough to do any trading. Please use our equity advice module to run different scenarios to ensure your current risk level and investment horizon are fully reflective of your current investing preferences in regards to Acura Pharma.
Pilot
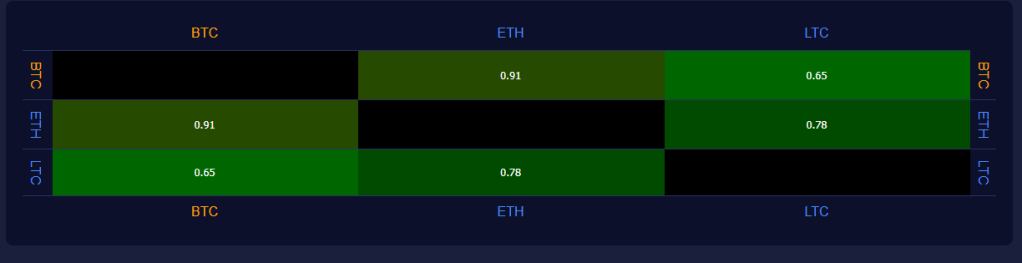

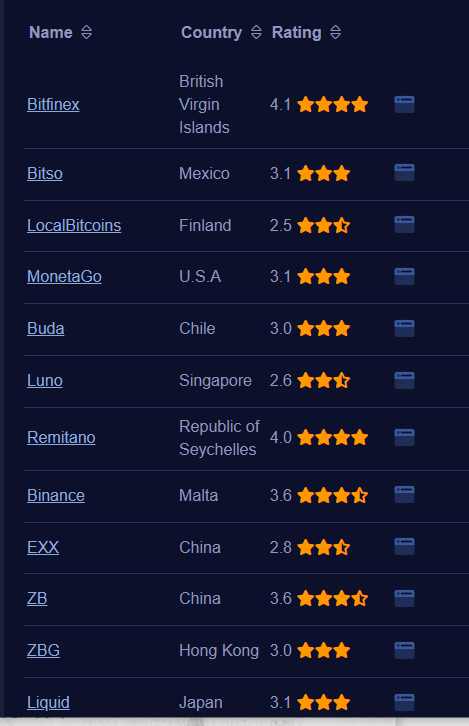
The cryptocurrency correlation table serves the same purpose as our conventional market correlation module. It is based on the idea that cryptocurrency investors can reduce their digital portfolio volatility by merely holding coins or tokens that are not perfectly correlated. Macroaxis provides an easy way to lookup pair correlation opportunities across multiple coins and exchanges using correlation tables.Every exchange in the market has its asset selection, and the market correlation between these assets is essential in building a portfolio that maximizes the risk-adjusted return on your crypto investing strategies. The correlation tables below can help investors find the exchange with the right combination of assets based on their objectives.Choosing the best crypto exchanges is a crucial prerequisite in successful cryptocurrency trading. If you err when finding the best exchanges, the risks of losses and delays in payments are imminent. Due diligence when choosing the right platform to use is thus vital to protect your cryptocurrency investment. The goal of any cryptocurrency investor is maximizing return and minimizing risk. One strategy for maximizing risk-adjusted returns is selecting the exchange that offers trading pairs that are not perfectly correlated to each other. Additionally, investors can reduce their exposure to individual coin risk by holding a diversified digital asset portfolio on a given exchange. Diversification will allow for the same portfolio return with reduced risk. The correlation screener will help you find relationships between any cryptocurrency on a given exchange, enabling you to manage your cryptocurrency portfolio risk more effectively.
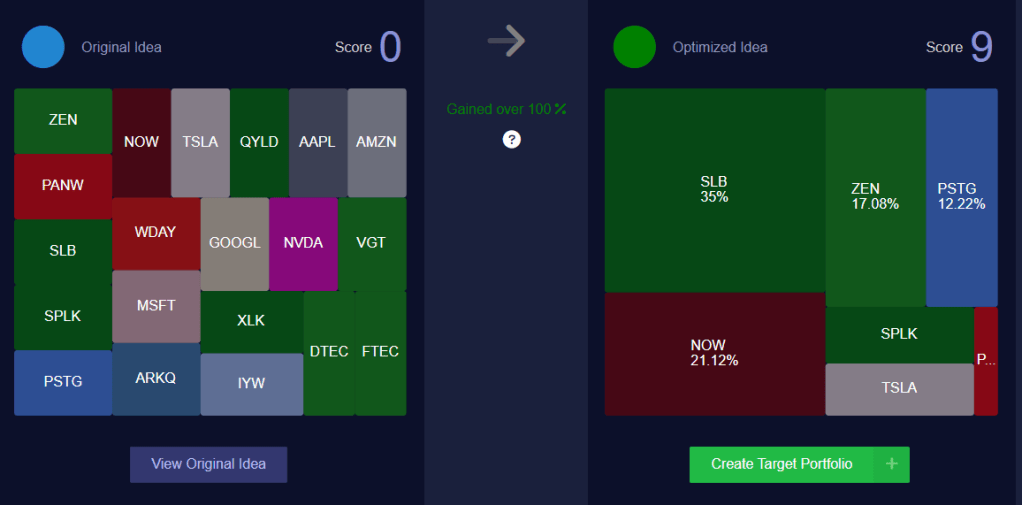
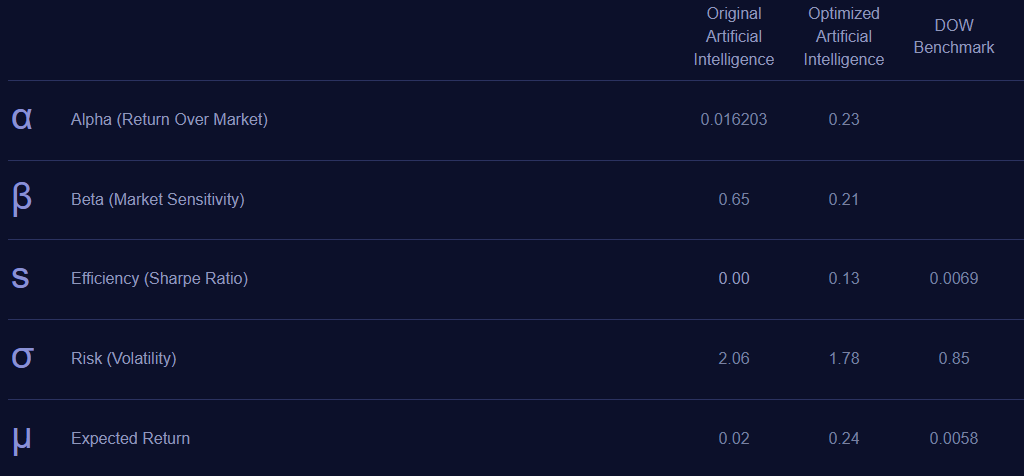
Use-Case 1: Optimized Artificial Intelligence
Below is one of the portfolios that could be originated from Artificial Intelligence idea. If you would invest 16,415 in this portfolio on April 18, 2021 and sell every single asset in this portfolio today you would earn a total of 3,586 from holding this portfolio or generate 21.84% return on investment over 360 days.
| Asset | Risk | Expected Return |
| Current | 2.06 | 0.02 |
| Optimized | 1.78 | 0.24 |
| Market | 0.8464 | 0.0058 |
| Cash | 0 | 0.01 |
| TSLA | 4.0229 | 0.017 |
| NOW | 3.6289 | 0.0734 |
| PSTG | 3.2338 | 0.2007 |
| QYLD | 1.3597 | 0 |
| AAPL | 1.89 | -0.014 |
| AMZN | 3.079 | -0.0526 |
| NVDA | 4.1827 | -0.2069 |
| ARKQ | 2.6462 | -0.1132 |
| SLB | 2.95 | 0.282 |
| ZEN | 2.6 | 0.4037 |
| PANW | 3.17 | 0.4127 |
| SPLK | 3.5746 | 0.2771 |
| GOOGL | 2.21 | -0.095 |
| MSFT | 2.059 | -0.0868 |
| FTEC | 2.054 | -0.14 |


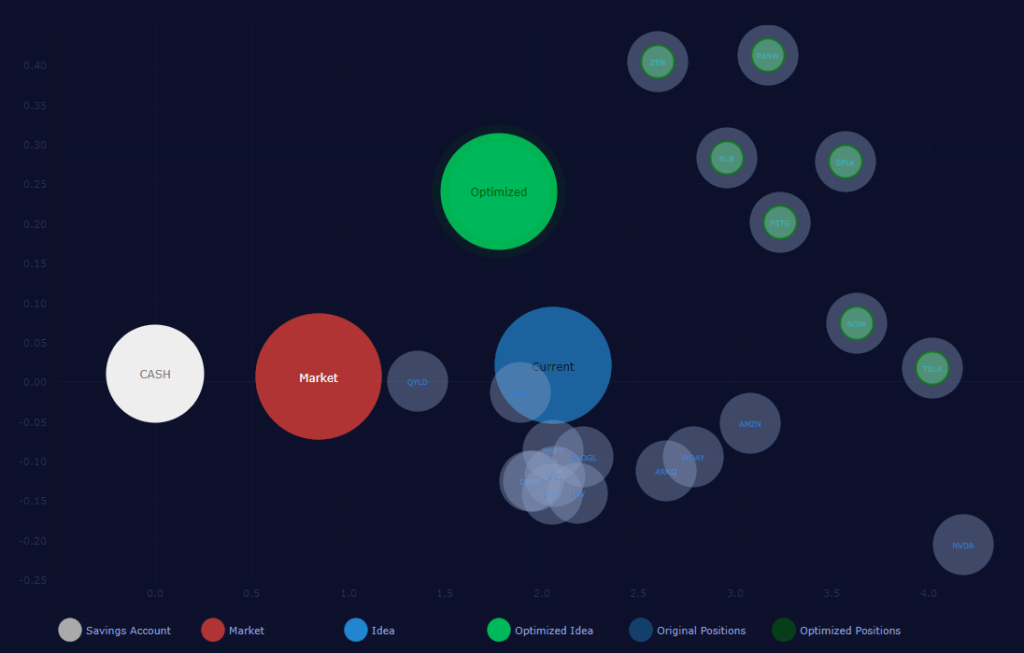
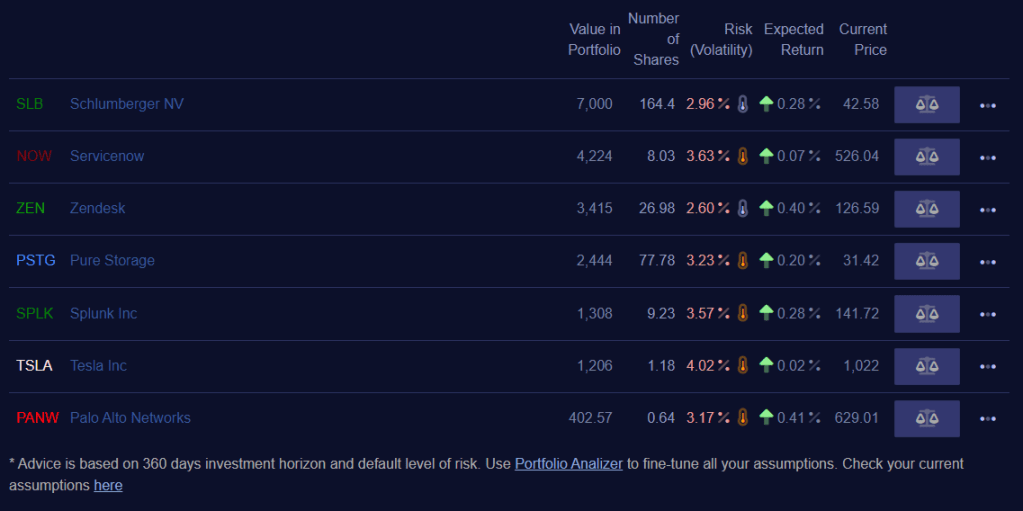
Suggested Asset Allocation And Market Analysis
Many investors optimize their portfolios to maintain a risk-return balance that meets their personal investing preferences and liquidity needs. Understanding the relationship between the Sharpe ratio, risk, and expected return will help you build an optimal portfolio out of your selected theme. The Sharpe ratios describe how much excess return you receive for the extra volatility you endure for holding a position in a themed portfolio. Below are the essential efficiency ratios that can help you quickly create a reliable input to your portfolio optimization process.
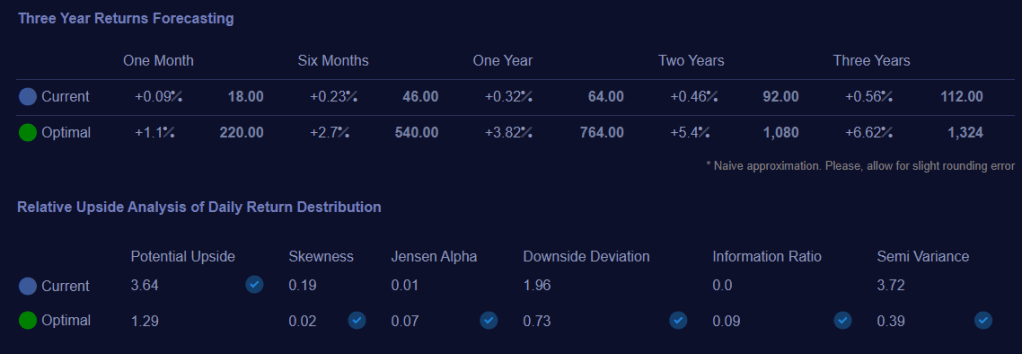
Technical Analysis Of Total Daily Returns
The below table shows technical indicators of the assets from the current unweighted theme. These indicators can be significantly improved after the theme is optimized. So, by diversifying this theme into an optimal portfolio, it is possible to reduce not only its total risk but also increase alpha, improve the information ratio and and increase the potential upside.
| Risk Adjusted Performance | 0.0906 | Market Risk Adjusted Performance | 1.16 |
| Mean Deviation | 0.6127 | Semi Deviation | 0.6267 |
| Downside Deviation | 0.728 | Coefficient Of Variation | 910.75 |
| Standard Deviation | 0.7589 | Variance | 0.5759 |
| Information Ratio | 0.0897 | Jensen Alpha | 0.073 |
| Total Risk Alpha | 0.0685 | Sortino Ratio | 0.0935 |
| Treynor Ratio | 1.15 | Maximum Drawdown | 3.3 |
| Value At Risk | (1.10) | Potential Upside | 1.29 |
| Downside Variance | 0.53 | Semi Variance | 0.3928 |
| Expected Short fall | (0.66) | Skewness | 0.0173 |
| Kurtosis | (0.53) | Cryptocurrency Directory | Correlation Matrix |
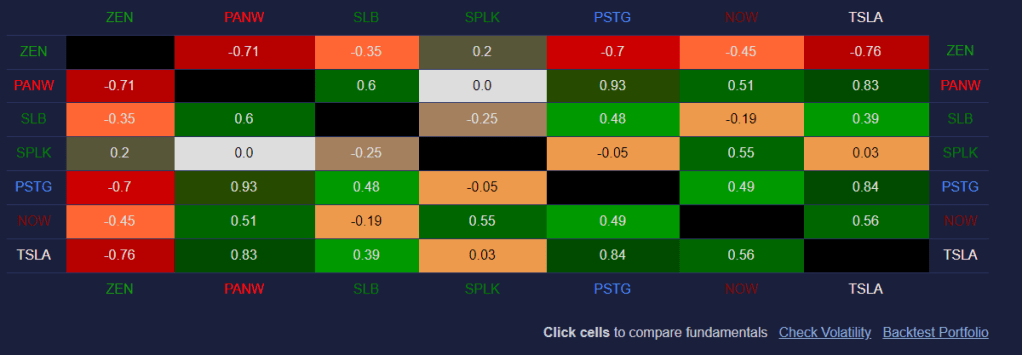
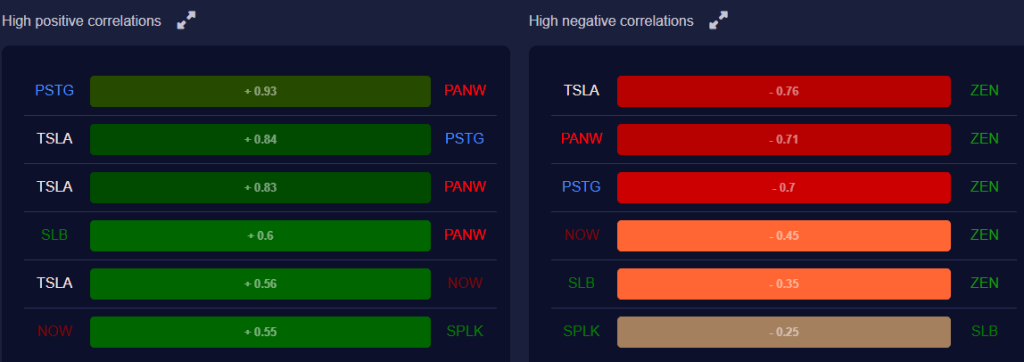
Correlation Matchups
The Correlation Coefficient is a useful tool to identify correlated or non-correlated securities, which is essential in developing a diversified portfolio. It tells us the relationship between two positions you have in your portfolio or considering acquiring. Over a given time period, the two securities movetogether when the Correlation Coefficient is positive. Conversely, the two assets move in opposite directions when the Correlation Coefficient is negative. Determining your positions’ relationship to each other is valuable for analyzing and projecting your portfolio’s future expected return and risk.
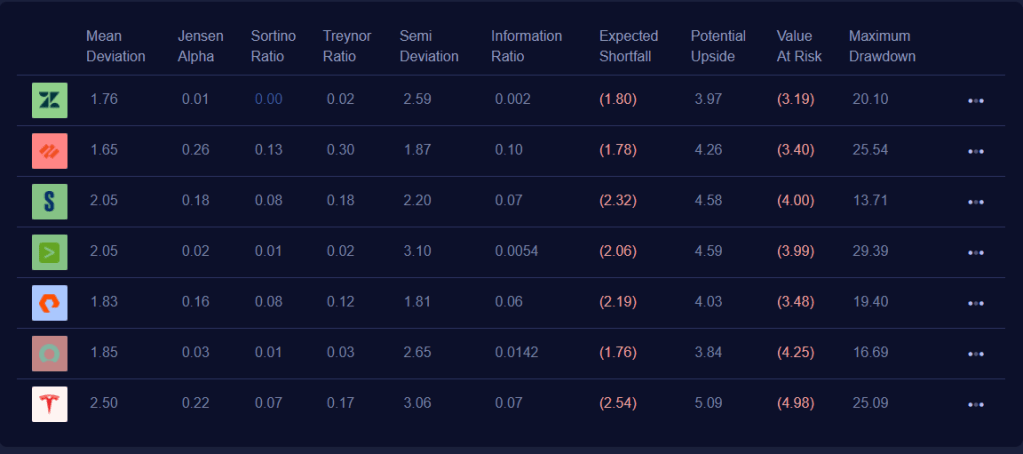
Risk-Adjusted Indicators
Nowadays, there is a big difference between company stock performing well and the company as a business doing well compared to the competition. There are way too many exceptions to the normal that no investors can tell for sure what’s good or bad unless they analyze multiple risk-adjusted performance indicators across the competition. These indicators are quantitative in nature and help investors forecast volatility and risk-adjusted expected returns across various positions.


Leave a comment