SeekingAlpha: A ‘Strong Buy’ Call on Genmab.
While analysts were issuing bearish calls on Danish biotech Genmab (GMAB), Seeking Alpha contributor Biologics had different thoughts. In fact, Genmab has risen about 6% for 2022 even as the broader biotech sector has shed about 27% for the year.
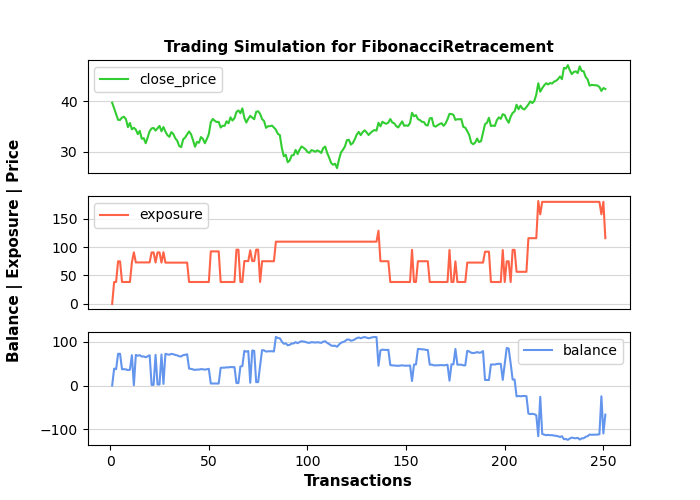
Let’s examine the Genmab stock in terms of HOLD-BUY-SELL trading signals using Fibonacci Retracement levels and related tti trading simulations.
Let’s set the working directory YOURPATH
import os
os.chdir(‘YOURPATH’)
os. getcwd()
and read the stock data
ticker = ‘GMAB’ #Our stock ticker name
import pandas
from pandas_datareader import data as pdr
import yfinance as yfin
yfin.pdr_override()
data = pdr.get_data_yahoo(ticker,start=’2022-01-03′,end=’2022-12-31′)
print(data)
[*********************100%***********************]  1 of 1 completed
                 Open       High        Low      Close  Adj Close    Volume
Date
2022-01-03  45.090000  46.490002  44.980000  46.180000  45.129204  58587900
2022-01-04  47.060001  48.430000  47.040001  47.990002  46.898018  74606700
2022-01-05  48.139999  48.369999  47.160000  47.180000  46.106449  57791600
2022-01-06  47.980000  48.160000  47.189999  48.130001  47.034836  52040900
2022-01-07  48.150002  49.310001  48.060001  49.180000  48.060944  59082600
...               ...        ...        ...        ...        ...       ...
2022-12-23  32.400002  32.580002  32.189999  32.470001  32.470001  21378600
2022-12-27  32.500000  32.669998  32.279999  32.529999  32.529999  22776100
2022-12-28  32.570000  32.970001  32.529999  32.770000  32.770000  30541000
2022-12-29  32.889999  33.160000  32.750000  33.139999  33.139999  22252900
2022-12-30  33.099998  33.299999  32.860001  33.119999  33.119999  28191300

[251 rows x 6 columns]
The alternative stock reader is as follows
import yfinance as yf
start = “2022-01-01”
end = ‘2022-12-31’
df = yf.download(‘GMAB’,start,end)
Let’s install tti
!pip install tti
and import FibonacciRetracement
from tti.indicators import FibonacciRetracement
fr_indicator = FibonacciRetracement(input_data=df)
Get indicator value for a specific date
print(‘\nTechnical Indicator value at 2022-12-30:’, fr_indicator.getTiValue(‘2022-12-30’))
Get the most recent indicator value
print(‘\nMost recent Technical Indicator value:’, fr_indicator.getTiValue())
Get signal from the indicator
print(‘\nTechnical Indicator signal:’, fr_indicator.getTiSignal())
Show the Graph for the calculated Technical Indicator
fr_indicator.getTiGraph().show()
Save the Graph for the calculated Technical Indicator
fr_indicator.getTiGraph().savefig(‘gmab_fr.png’)
print(‘\nGraph for the calculated fr indicator data, saved.’)
Execute simulation based on trading signals
simulation_data, simulation_statistics, simulation_graph = \
fr_indicator.getTiSimulation(
close_values=df[[‘close’]], max_exposure=None,
short_exposure_factor=1.5)
print(‘\nSimulation Data:\n’, simulation_data)
print(‘\nSimulation Statistics:\n’, simulation_statistics)
Save the Graph for the executed trading signal simulation
simulation_graph.savefig(‘gmab_simulation_fr.png’)
print(‘\nGraph for the executed trading signal simulation, saved.’)
The result of this sequence is as follows:

Technical Indicator value at 2022-12-30: [47.06, 42.2857, 39.3321, 36.945, 34.5579, 26.83]
Technical Indicator signal: ('hold', 0)
Simulation Statistics:
 {'number_of_trading_days': 251, 'number_of_buy_signals': 17, 'number_of_ignored_buy_signals': 0, 'number_of_sell_signals': 18, 'number_of_ignored_sell_signals': 0, 'last_stock_value': 42.38, 'last_exposure': 115.51, 'last_open_long_positions': 0, 'last_open_short_positions': 2, 'last_portfolio_value': -84.76, 'last_earnings': 18.04, 'final_balance': -66.72}
Fibonacci retracement levels indicate reversal points with uncanny accuracy. This analysis will become even more powerful when used in conjunction with other indicators or technical signals such as candlestick patterns, trendlines, volume, momentum oscillators, and moving averages.
Tutorials
The Ultimate Guide to Fibonacci Retracement levels
Fibonacci Retracement Levels 101
What Are Fibonacci Retracement Levels, and What Do They Tell You?
Explore More
Python Technical Analysis for BioTech – Get Buy Alerts on ABBV in 2023


Make a one-time donation
Make a monthly donation
Make a yearly donation
Choose an amount
Or enter a custom amount
Your contribution is appreciated.
Your contribution is appreciated.
Your contribution is appreciated.

Leave a comment