
Featured Photo by Mika Baumeister on Unsplash
This post explains the nuts & bolts of the MobiDev Machine Learning (ML) framework of marketing-driven Demand Forecasting (DF) methods in conjunction with the upcoming SIBOS 2022 event (OCT 10-13, 2022 Amsterdam, Netherlands).
The MobiDev ML approach consists of 5 steps:
- A helicopter view of available input data
- Setting business goals and success factors KPI’s
- Data Preparation and Exploratory Data analysis (EDA)
- Training, testing and cross-validation of DF models
- Final deployment of DF trained models
Contents:
Step 1
The first stage when initiating the DF project is to provide the client
with meaningful data insights. The process includes the following tasks:
- Gather available data
- Briefly review the data structure, accuracy, and consistency
- Run a few data tests and proof-of-concept pilots
- Look through a comprehensive statistical summary
Step 2
The crucial point is to identify DF success metrics or KPI’s by considering the following three aspects:
- Product Categories
- Time Frame
- Accuracy
The example of metrics to measure the DF accuracy are MAPE (Mean Absolute
Percentage Error) and MAE (Mean Absolute Error).
Step 3
The following data could be used for building DF models:
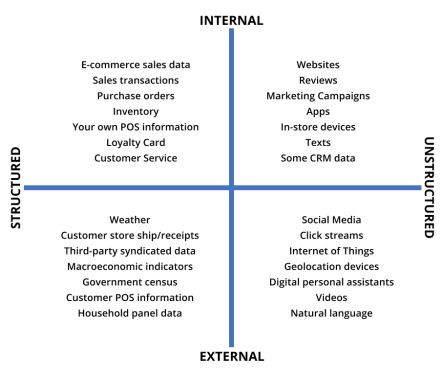
Source: MobiDev
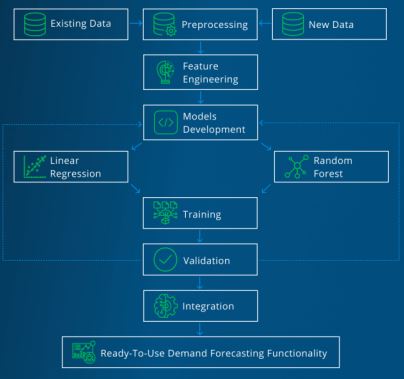
Step 4
There are no “one-size-fits-all” DF algorithms. Often, DF pipelines combine several ML workflows such as
- ARIMA/SARIMA
- Linear Regression
- XGBoost
- K-Nearest Neighbors
- Random Forest
- Long Short-Term Memory (LSTM)
DF feature engineering is the in-depth use of DF domain knowledge to create an optimal set of features that result in more accurate ML models.

Source: MobiDev.
When training DF models, data scientists usually use historical data. Validation requires the (hyper-parameter) optimization of model parameters to maximize model performance.
For example, in the Retail ERP & POS Comcash case study, we predict how much food, clothes, and computer equipment will be sold in each supermarket within the next week.
Source: MobiDev
Step 5
The final step is the MLOps procedure that tests ML models (output of step 4) in the real-time production environment.
DF MLOps help us to learn:
- How to take ML projects from planning to production
- Why ML projects fail and how to avoid common mistakes
- How to productionize and make ML work at scale
- How technologies and processes interact in a large ML initiative.
When deploying DF eco-systems, it’s essential to understand that they are vulnerable to anomalies like the COVID-19 pandemic.
PRODUCT TYPE INFLUENCES MODELS FOR SALES FORECASTING
The product type is an important factor to consider for the DF model. For
example, a perishable product demand model should not overestimate demand
since the excess product will be lost to waste. Instead, the modeling error should
always be tailored to be a lower inventory level than actual demand. For example,
a perishable item that has an actual demand of 100 cases, the prediction of selling
90 cases is preferred over the prediction of 110 cases. Missing the sales of 10 cases
is a better result than wasting 10 cases, even though the actual error is the same
percentage. Extra care needs to be taken in preparing data when working with
perishable items
HOW FREQUENCY IMPACTS MODELS FOR SALES FORECASTING
The frequency used in a time-series analysis depends on the patterns of demand
for a specific business. Some businesses have patterns of demand that are based
on the intervals of hours, days, or weeks. Restaurants have hourly demand
patterns. Shopping malls have daily demand patterns and weekend peaks patterns.
Highly seasonal goods, such as holiday decorations, have specific weekly patterns
each year.
Takeaways
- Generally, ML DF can solve multiple demand and sales forecasting tasks (forecasting customer engagement, future trends, brand development, marketing campaigns, resources usage, financial risks, etc.).
- In the Retail ERP & POS Comcash case study, the average accuracy distribution for all chains is 95.96%.
- A large business collects more historical data, making it less challenging to identify the behavioral patterns of customers.
- Using a time-series approach, we can see clear patterns that have four key components (Trend, Cycle, Seasons, and Random Components).
- The approach used for a small business is the hypothesis testing to find a correlation between a predictor and the volume of sales.
- Generally, Small Business Random Product Sales Lacking Clear Patterns.
- In the case of poor DF patterns, external data may be added to the DF model. Examples of external data may be currency exchange rates, stock market performance, consumer price index, or another factor influencing the economy.
- Compared to offline businesses, e-commerce has maximum number of predictors and external factors that can easily be incorporated into sales forecasting models.
- Data from a point-of-sale system is not needed when a website collects the pertinent data for e-commerce sales.
- E-commerce sales are enhanced by building a recommendation system based on past customer experience.
- Large online retailers use the Market Basket Analysis for marketing purposes.
- Predictive models are strongly influenced by regional factors that include customer behavior and cultural determinants. Marketing campaigns may be regionally specific and have a different impact that depends on where a customer is located.
- Holidays may vary between regions, which might be a consideration for adjusting the model. Legal issues may limit the use of certain data in different regions.
- The three types of DF errors are Absolute Error (AE), Percentage Error (PE), and Absolute Percentage Error (APE).
- The overall DF accuracy is 100%-APE.
- A higher sales volume increases tolerance for DF error.
- The future potential of this technology depends upon new ML trends emerging. The ultimate goal is to understand what added value it can deliver to modern businesses.


Leave a comment