
In this post, we will apply the Guillen’s asset rebalancing algorithm (cf. the Python code) to the following risk-aware portfolio:
stocks = [‘SPY‘, ‘XOM‘, ‘ABBV‘, ‘AZN‘, ‘LMT‘]
The initial portfolio value to be allocated is
portfolio_value = 10**6
and the weight allocation per asset is
weights = [0.15 , 0.30, 0.40, 0.075, 0.075]
Conventionally, our benchmark is S&P500
benchmark = ‘^GSPC’
The time factors are as follows:
Start date 2013-01-02
End date 2023-03-17
In-sample months 83
Out-of-sample months 38
Download Input Data
Let’s set the working directory
import os os.chdir(‘YOURPATH’)
os. getcwd()
and
import the libraries
import yfinance as yf
import pandas as pd
import numpy as np
import pyfolio as py
import plotly.graph_objs as go
from plotly.subplots import make_subplots
import warnings
warnings.filterwarnings(“ignore”)
followed by the above-mentioned user input parameters.
Let’s download the data
stock_data = yf.download(stocks, start=start_date)[‘Adj Close’]
stock_data = stock_data.dropna()
stock_data = stock_data.reindex(columns=stocks)
stock_prices = stock_data[stocks].values
[*********************100%***********************] 5 of 5 completed
and define the shares dataframe
shares_df = pd.DataFrame(index=[stock_data.index[0]])
for s,w in zip(stocks, weights):
shares_df[s + ‘_shares’] = np.floor((portfolio_value * np.array(w)) / stock_data[s][0])
shares_df

Rebalancing Engine Run
- Initialize variables
balance_year = stock_data.index[0].year # Since we rebalance based on year
signal = False
count = 0 # for loop count purpose
Store previous values in a dictionary
prev_values = {}
- Calculate portfolio value for the first day by mult. shares * price per asset at t=0
portfolio_value = sum([shares_df.loc[stock_data.index[0], s + ‘_shares’] * stock_data.loc[stock_data.index[0], s] for s in stocks])
for day in stock_data.index:
count += 1
if day == stock_data.index[0]:
shares_df.loc[day] = shares_df.loc[day] # First day
# Store initial values as previous values
for col in shares_df.columns:
prev_values[col] = shares_df.loc[day, col]
elif day.year != balance_year: # THIS IS OUR SIGNAL
    signal = True
    # calculate new shares based on the new portfolio value and weights
    new_shares = [np.floor((portfolio_value * w) / stock_data[s][day]) for s,w in zip(stocks, weights)]
    shares_df.loc[day, :] = new_shares
    balance_year = day.year
    count += 1
    # print(f'Rebalance: {day.date()}, count: {count}') # uncomment to debug days 😉
    # Store new values as previous values
    for col in shares_df.columns:
        prev_values[col] = shares_df.loc[day, col]

else:
    signal = False
    # Use previous values if it is not a rebalancing date
    shares_df.loc[day, :] = [prev_values[col] for col in shares_df.columns]
    # print(f'Not rebalance, regular day: {day.date()}') # uncomment to debug days 😉

# Calculate asset values and portfolio value for the current day
asset_values = [shares_df.loc[day, s + '_shares'] * stock_data.loc[day, s] for s in stocks]
portfolio_value = sum(asset_values)
stock_data.loc[day, 'Signal'] = signal
stock_data.loc[day, 'Portfolio_Value'] = portfolio_value

# Add shares to stock data frame to have all together
for s in stocks:
    stock_data.loc[day, s + '_shares'] = shares_df.loc[day, s + '_shares']
    stock_data.loc[day, s + '_value'] = shares_df.loc[day, s + '_shares'] * stock_data.loc[day, s]
Calculate log returns for portfolio
stock_data[‘Portfolio_Value_rets’] = np.log(stock_data[‘Portfolio_Value’] / stock_data[‘Portfolio_Value’].shift(1))
Calculate log returns for each stock and asset weight
for stock in stocks:
stock_data[f'{stock}_rets’] = np.log(stock_data[stock] / stock_data[stock].shift(1))
stock_data[stock + ‘_weight’] = stock_data[stock + ‘_value’] / stock_data[‘Portfolio_Value’]
Benchmark data download and return
start_date_benchmark = stock_data.index[0]
benchmark_data = yf.download(benchmark, start=start_date_benchmark)
benchmark_data = benchmark_data.dropna()
benchmark_data[‘benchmark_rets’] = np.log(benchmark_data[‘Adj Close’] / benchmark_data[‘Adj Close’].shift(1))
benchmark_data[‘benchmark_rets’] = benchmark_data[‘benchmark_rets’].dropna()
[*********************100%***********************] 1 of 1 completed
Data timezone UTC unification for pyfolio valuation
stock_data.index = stock_data.index.tz_localize(‘UTC’)
benchmark_data.index = benchmark_data.index.tz_localize(‘UTC’)
live_date = pd.Timestamp(live_date, tz=’UTC’)
Output Data Visualization
from IPython.core.display import display, HTML
display(HTML(“”))
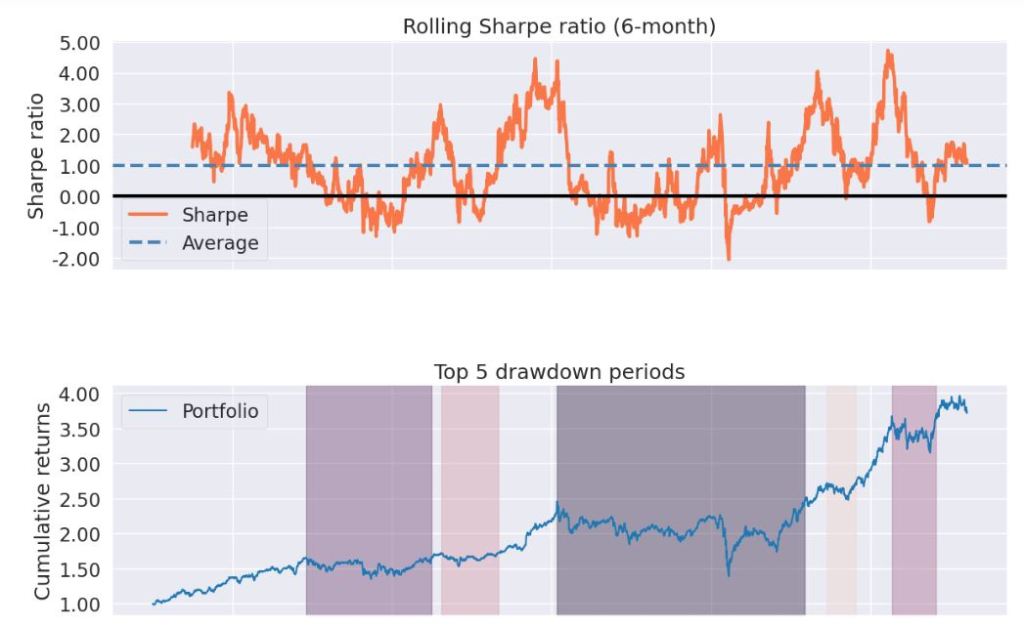
py.create_full_tear_sheet(stock_data[‘Portfolio_Value_rets’], benchmark_rets = benchmark_data[‘benchmark_rets’], live_start_date = live_date)


2014 2016 2018 2020 2022


Summary
We have implemented the following portfolio rebalancing strategy in Python:
- Define the assets, weights, and initial capital for investment.
- Select the benchmark and relevant dates.
- Assign initial capital to each asset based on desired weights.
- Implement the rebalancing engine based on monthly, yearly, daily, or signal-based triggers.
- Monitor the portfolio’s performance numerically or visually and extract insights.
Our output out-of-sample data are as follows:
- Return at End date (2023-03-17): 3.5+/- 2 %
- Annual return 17.3%
- Cumulative returns 66.6%
- Annual volatility 23.4%
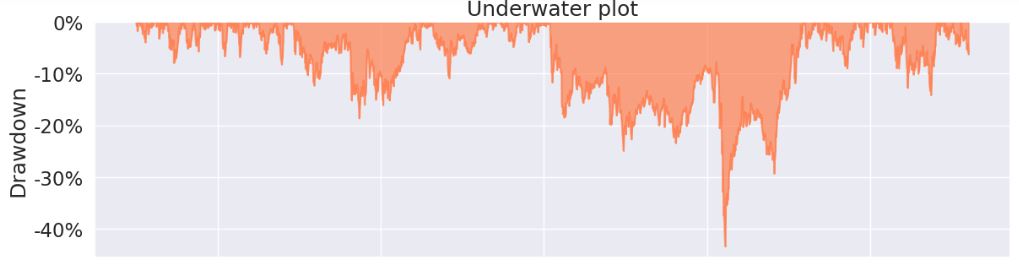
- Max drawdown -38.6%
- Calmar ratio 0.45
- Sharpe ratio 0.8
- Omega ratio 1.16
- Sortino ratio 1.09
- Alpha 0.15
- Beta 0.72
- 4 stress events
- 5 drawdown periods
Explore More
- Bear vs. Bull Portfolio Risk/Return Optimization QC Analysis
- Risk/Return POA – Dr. Dividend’s Positions
- Portfolio Optimization Risk/Return QC – Positions of Humble Div vs Dividend Glenn
- Risk/Return QC via Portfolio Optimization – Current Positions of The Dividend Breeder
- Stock Portfolio Risk/Return Optimization
- Stock Market ’22 Round Up & ’23 Outlook: Zacks Strategy vs Seeking Alpha Tactics
- XOM SMA-EMA-RSI Golden Crosses ’22
- Python Technical Analysis for BioTech – Get Buy Alerts on ABBV in 2023
- A Comparative Analysis of The 3 Best Global Growth Stocks in Q1’23 – 2. AZN


Make a one-time donation
Make a monthly donation
Make a yearly donation
Choose an amount
Or enter a custom amount
Your contribution is appreciated.
Your contribution is appreciated.
Your contribution is appreciated.
DonateDonate monthlyDonate yearly
Leave a comment