
Featured Photo by Anna Shvets on Pexels
- The objective of this post is to develop the ECG Early Warning System (EWS) by interpreting (sub-)critical deformations of heart tissues in terms of the stress-strain failure curve. Stress and strain are important concepts in materials engineering and can be related through this curve.
- If you apply some stress to the heart muscle and measure the resulting strain, or vice versa, you can create a stress vs. strain curve like the one shown below for a typical human heart.

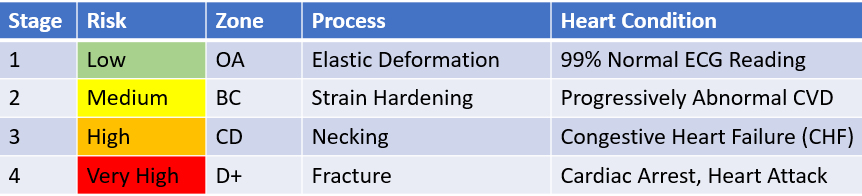
- Typical stress-strain plot for a heart: The graph begins with elastic deformations (stage 1) and ends at the fracture point (stage 4).
- We see that the heart elasticity zone OA starts off with stress being proportional to strain, which means that the heart muscle is operating in its linear region.
- Heart tissues deform when pushed, pulled, and twisted. Elasticity zone OA is the measure of the amount that the heart can return to its original shape after these external forces and pressures stop.
- The two parameters that determine the elasticity of a material are its elastic modulus and its elastic limit. A low elastic modulus is typical for materials that are easily deformed under a load; for example, a rubber band. If the stress under a load becomes too high, then when the load is removed, the material no longer comes back to its original shape and size, but relaxes to a different shape and size: The material becomes permanently deformed. The elastic limit A is the stress value beyond which the material no longer behaves elastically but becomes permanently deformed (cf. zone AB).
- For stresses beyond the elastic limit A, a material exhibits plastic behavior. This means the material deforms irreversibly and does not return to its original shape and size, even when the load is removed. When stress is gradually increased beyond the elastic limit, the material undergoes plastic deformation. Rubber-like materials show an increase in stress with the increasing strain, which means they become more difficult to stretch and, eventually, they reach a fracture point where they break.
- One of the plastic deformation stages in the stress-strain curve is the strain hardening region BC. This region starts as the strain goes beyond the yield point and ends at the ultimate strength point, the maximal stress shown in the stress-strain curve. In this region, the stress mainly increases as the material elongates, except that there is a nearly flat region at the beginning. The strain hardening region that occurs when the specimen is subjected to the maximum stress it can sustain (also called the ultimate tensile strength or UTS).
- The necking region CD where the neck forms. At this point, the stress that the material can sustain decreases rapidly as it approaches fracture D.
- Here is a sketch of stress-strain curves for brittle, ductile materials and rubber network on one graph.
- It is clear that brittle < the heart tissues < rubber network.

- Think of a paperclip. If you bend it just a little, it will bounce back every time. This is the elastic region. If you bend it far, however, you will permanently bend the clip.
- At a certain stress, the material will leave the elastic region. This stress is called the “yield strength.”
- At any point past the yield strength, the material will suffer permanent deformation (stage 2).

Explore More
AI-Based ECG Recognition – EOY ’22 Status
ML-Assisted ECG/EKG Anomaly Detection using LSTM Autoencoder
Embed Socials
Infographic


One-Time
Monthly
Yearly
Make a one-time donation
Make a monthly donation
Make a yearly donation
Choose an amount
¤5.00
¤15.00
¤100.00
¤5.00
¤15.00
¤100.00
¤5.00
¤15.00
¤100.00
Or enter a custom amount
¤
Your contribution is appreciated.
Your contribution is appreciated.
Your contribution is appreciated.

Leave a comment