
The relationship between wines and wine reviews has been studied from many different perspectives. Economically, the relationship between price, wine quality and wine ratings is interesting as a high rating by a famous wine expert can make a substantial difference to product sales.
In this study we aim to discover stylistic and lexical patterns with which we can relate wine reviews to wine properties automatically.
Ultimately, we need to create a predictive model to identify wines through blind tasting like a master sommelier would. The first step in this journey is gathering some data to train a model.
The Kaggle dataset hosts 130k wine reviews with variety, location, winery, price, and description. This dataset offers some great opportunities for sentiment NLP analysis and other text related predictive models.
Our end-to-end workflow consists of the following 5 steps:
- Start with loading all necessary libraries
- Download the input dataset as dataframe
- Exploratory Data Analysis (EDA)
- Generate Wordcloud images
- NLP Text Interpretations

Table of Contents:
Basics
Let’s look at the 9 key words before starting in wine:
Grape Variety, Origin, Vintage, New World and Old World, The Eye, The Nose, The Taste, Flavours, and Weight.
The world of wine has its very own vocabulary, its own jargon. Understanding it means you will be able to both understand people describing a wine but it also means you can be very descriptive when you talk about wine.
Preparations
Let’s set the working directory YOURPATH
import os
os.chdir(‘YOURPATH’)
os. getcwd()
and start with importing all necessary libraries
import numpy as np
import pandas as pd
from os import path
from PIL import Image
from wordcloud import WordCloud, STOPWORDS, ImageColorGenerator
import matplotlib.pyplot as plt
Input Data
Let’s download the input dataset
df = pd.read_csv(“winemag130.csv”, index_col=0)
and check the first 5 rows
df.head()

Let’s print out the general information about wine reviews
print(“There are {} observations and {} features in this dataset. \n”.format(df.shape[0],df.shape[1]))
print(“There are {} types of wine in this dataset such as {}… \n”.format(len(df.variety.unique()),
“, “.join(df.variety.unique()[0:5])))
print(“There are {} countries producing wine in this dataset such as {}… \n”.format(len(df.country.unique()),
“, “.join(df.country.unique()[0:5])))
There are 129971 observations and 13 features in this dataset.

There are 708 types of wine in this dataset such as White Blend, Portuguese Red, Pinot Gris, Riesling, Pinot Noir...

There are 44 countries producing wine in this dataset such as Italy, Portugal, US, Spain, France...
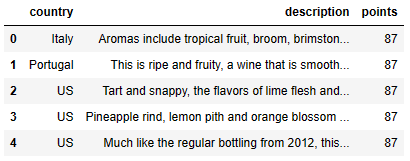
The crucial features are as follows
df[[“country”, “description”,”points”]].head()
Let’s group the data by country
country = df.groupby(“country”)
and check the summary statistic of all countries
country.describe().head()

Let’s sort the data by points
country.mean().sort_values(by=”points”,ascending=False).head()

EDA
Let’s look at the bar plot “Number of Wines” vs “Country of Origin”
plt.figure(figsize=(15,10))
country.size().sort_values(ascending=False).plot.bar()
plt.xticks(rotation=50)
plt.xlabel(“Country of Origin”)
plt.ylabel(“Number of Wines”)
plt.show()

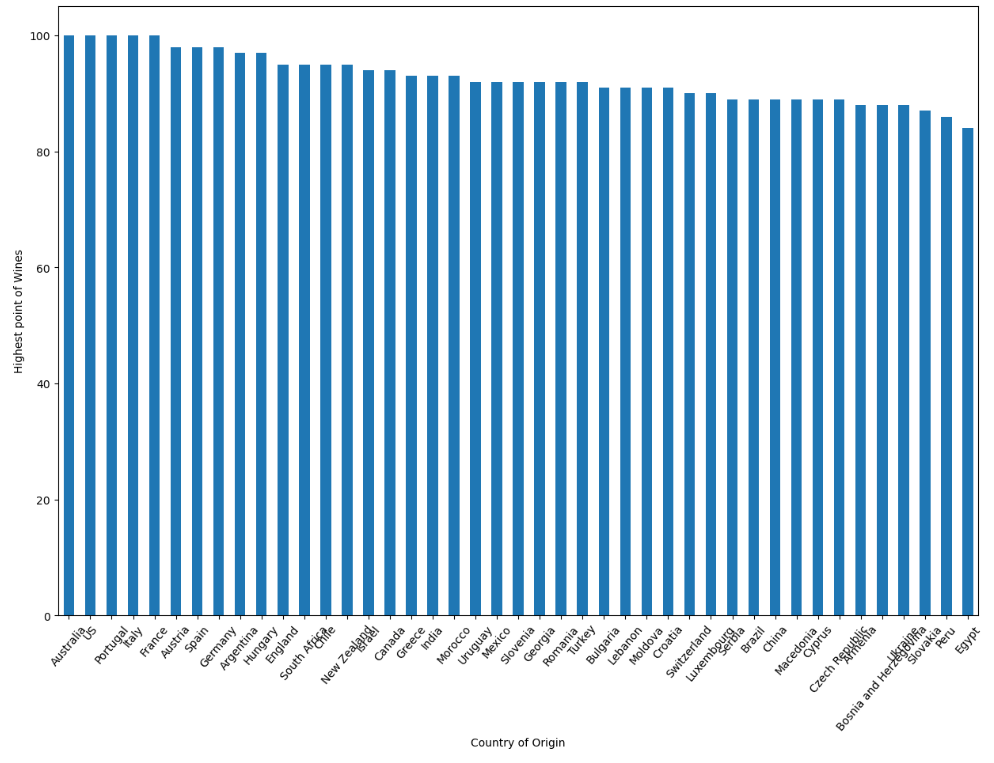
Let’s create the bar plot “Highest point of Wines” vs “Country of Origin”
plt.figure(figsize=(15,10))
country.max().sort_values(by=”points”,ascending=False)[“points”].plot.bar()
plt.xticks(rotation=50)
plt.xlabel(“Country of Origin”)
plt.ylabel(“Highest point of Wines”)
plt.show()
NLP Wordclouds
Let’s start with one review:
text = df.description[0]
Create and generate the wordcloud image:
wordcloud = WordCloud().generate(text)
Let’s display the generated image:
plt.imshow(wordcloud, interpolation=’bilinear’)
plt.axis(“off”)
plt.show()

Let’s lower max_font_size, change the maximum number of word and lighten the background:
wordcloud = WordCloud(max_font_size=50, max_words=100, background_color=”white”).generate(text)
plt.figure()
plt.imshow(wordcloud, interpolation=”bilinear”)
plt.axis(“off”)
plt.show()

Save the image in the img folder:
wordcloud.to_file(“first_review.png”)
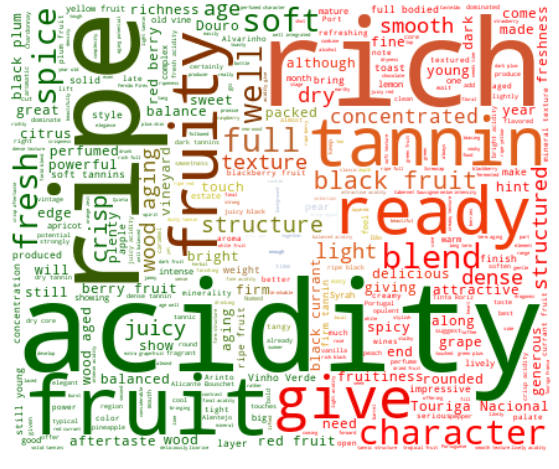
Let’s look at all reviews
text = ” “.join(review for review in df.description)
print (“There are {} words in the combination of all review.”.format(len(text)))
There are 31661073 words in the combination of all review.
Let’s create the English stopword list:
stopwords = set(STOPWORDS)
stopwords.update([“drink”, “now”, “wine”, “flavor”, “flavors”])
and generate a word cloud image
wordcloud = WordCloud(stopwords=stopwords, background_color=”white”).generate(text)
Let’s display the generated image:
plt.imshow(wordcloud, interpolation=’bilinear’)
plt.axis(“off”)
plt.show()

Let’s apply the following mask
wine_mask = np.array(Image.open(“winebottle.jpg”))
wine_mask

and define the function
def transform_format(val):
if val == 0:
return 255
else:
return val
Let’s create a word cloud image with the above mask
wc = WordCloud(background_color=”white”, max_words=1000, mask=wine_mask,
stopwords=stopwords, contour_width=3, contour_color=’firebrick’)
Generate a wordcloud
wc.generate(text)
store to file
wc.to_file(“wordcloudwine.png”)
and plot
plt.figure(figsize=[20,10])
plt.imshow(wc, interpolation=’bilinear’)
plt.axis(“off”)
plt.show()

Let’s select the following 5 countries
country.size().sort_values(ascending=False).head()
country
US          54504
France      22093
Italy       19540
Spain        6645
Portugal     5691
dtype: int64
taken from the sorted list of countries
country.size().sort_values(ascending=False).head(10)
country
US           54504
France       22093
Italy        19540
Spain         6645
Portugal      5691
Chile         4472
Argentina     3800
Austria       3345
Australia     2329
Germany       2165
dtype: int64
Let’s join all reviews of each country:
usa = ” “.join(review for review in df[df[“country”]==”US”].description)
fra = ” “.join(review for review in df[df[“country”]==”France”].description)
ita = ” “.join(review for review in df[df[“country”]==”Italy”].description)
spa = ” “.join(review for review in df[df[“country”]==”Spain”].description)
por = ” “.join(review for review in df[df[“country”]==”Portugal”].description)
USA:
Generate a word cloud image
mask = np.array(Image.open(“usflag.jpg”))
wordcloud_usa = WordCloud(stopwords=stopwords, background_color=”white”, mode=”RGBA”, max_words=1000, mask=mask).generate(usa)
Create coloring from the mask image
image_colors = ImageColorGenerator(mask)
plt.figure(figsize=[7,7])
plt.imshow(wordcloud_usa.recolor(color_func=image_colors), interpolation=”bilinear”)
plt.axis(“off”)
Store to file
plt.savefig(“wordcloud_us_wine.png”, format=”png”)
and plot
plt.show()


Portugal:
Generate a word cloud image
mask = np.array(Image.open(“ptflag.jpg”))
wordcloud_usa = WordCloud(stopwords=stopwords, background_color=”white”, mode=”RGBA”, max_words=1000, mask=mask).generate(por)
Create coloring from image
image_colors = ImageColorGenerator(mask)
plt.figure(figsize=[7,7])
plt.imshow(wordcloud_usa.recolor(color_func=image_colors), interpolation=”bilinear”)
plt.axis(“off”)
Store to the file
plt.savefig(“wordcloud_pt_wine.png”, format=”png”)
and plot
plt.show()

France:
Generate a word cloud image
mask = np.array(Image.open(“franceflag.jpg”))
wordcloud_usa = WordCloud(stopwords=stopwords, background_color=”white”, mode=”RGBA”, max_words=1000, mask=mask).generate(fra)
Create coloring from image
image_colors = ImageColorGenerator(mask)
plt.figure(figsize=[7,7])
plt.imshow(wordcloud_usa.recolor(color_func=image_colors), interpolation=”bilinear”)
plt.axis(“off”)
Store to the file
plt.savefig(“wordcloud_france_wine.png”, format=”png”)
and plot
plt.show()


Italy:
Generate a word cloud image
mask = np.array(Image.open(“italyflag.jpg”))
wordcloud_usa = WordCloud(stopwords=stopwords, background_color=”white”, mode=”RGBA”, max_words=1000, mask=mask).generate(ita)
Create coloring from image
image_colors = ImageColorGenerator(mask)
plt.figure(figsize=[7,7])
plt.imshow(wordcloud_usa.recolor(color_func=image_colors), interpolation=”bilinear”)
plt.axis(“off”)
Store to the file
plt.savefig(“wordcloud_italy_wine.png”, format=”png”)
and plot
plt.show()


Spain:
Generate a word cloud image
mask = np.array(Image.open(“spainflag.jpg”))
wordcloud_usa = WordCloud(stopwords=stopwords, background_color=”white”, mode=”RGBA”, max_words=1000, mask=mask).generate(spa)
Create coloring from image
image_colors = ImageColorGenerator(mask)
plt.figure(figsize=[7,7])
plt.imshow(wordcloud_usa.recolor(color_func=image_colors), interpolation=”bilinear”)
plt.axis(“off”)
Store to the file
plt.savefig(“wordcloud_spain_wine.png”, format=”png”)
and plot
plt.show()


Summary
- In this study, we used a corpus of online wine reviews and their structured metadata and extracted three types of information from the review text: a set of lexical bag-of-words features, a set of domain-specific terminological features, and a set of semantic word embedding cluster features.
- Our results confirm that wine experts do share a common vocabulary to describe wines and they use this in a consistent way, which makes it possible to automatically predict wine characteristics based on the review text alone.
- This study shows that the language of wine reviews is richly informative (contra previous claims), and demonstrates the important role of NLP methods to address core questions about the limits and possibilities of language more generally.
Explore More
Wine Reviews Visualization and Natural Language Process (NLP)
Sentiment Analysis with Wine Reviews
Grab Your Wine. It’s Time to Demystify ML and NLP
Infographic


Make a one-time donation
Make a monthly donation
Make a yearly donation
Choose an amount
Or enter a custom amount
Your contribution is appreciated.
Your contribution is appreciated.
Your contribution is appreciated.

Leave a comment