
Featured Image by TradingView.com
In this article, we will implement the CodeX-Aroon auto-trading strategy to examine the AAPL stock 2022 in terms of stock trends, trading signals, positions, backtesting, and benchmarking against SPY ETF.
Contents:
Aroon Indicator
The Aroon Indicator (often referred to as Aroon Up Down) is a range bound, technical indicator that is actually a set of two separate measurements designed to measure how many periods have passed since price has recorded an n-period high or low with “n” being a number of periods set at the trader’s discretion. For example a 25 Day (long-term) Aroon-Up will take the number of days since price last recorded a 25 day high and then calculate a number between 0 and 100. A 25 Day Aroon-Down will do the same thing except is will calculate a number based of the number of days since a 25 day low. This number is intended to quantify the strength of a trend (if there is one). The closer the number is to 100, the stronger the trend. Aroon is not only good at identifying trends, it is also a useful tool for identifying periods of consolidation.
Auto-Trading
Let’s set the working directory YOURPATH
import os
os.chdir(‘YOURPATH’)
os. getcwd()
and import the key libraries
import pandas as pd
import numpy as np
import requests
import matplotlib.pyplot as plt
from math import floor
from termcolor import colored as cl
plt.style.use(‘fivethirtyeight’)
plt.rcParams[‘figure.figsize’] = (20, 10)
We need to define the following user parameters
myticker=’AAPL’
mydate=’2022-01-01′
myamount=10000
mywin=25
Let’s get the AAPL historical data using the API key linked to the user account on twelvedata.com
def get_historical_data(symbol, start_date):
api_key = ‘API key’
api_url = f’https://api.twelvedata.com/time_series?symbol={symbol}&interval=1day&outputsize=5000&apikey={api_key}’
raw_df = requests.get(api_url).json()
df = pd.DataFrame(raw_df[‘values’]).iloc[::-1].set_index(‘datetime’).astype(float)
df = df[df.index >= start_date]
df.index = pd.to_datetime(df.index)
return df
tsla = get_historical_data(myticker, mydate)
tsla

let’s calculate the Aroon up/down indicators
def get_aroon(symbol, lookback, start_date):
api_key = ‘API key’
api_url = f’https://api.twelvedata.com/aroon?symbol={symbol}&interval=1day&time_period={lookback}&outputsize=5000&apikey={api_key}’
raw_df = requests.get(api_url).json()
df = pd.DataFrame(raw_df[‘values’]).iloc[::-1].set_index(‘datetime’).astype(float)
df = df[df.index >= start_date]
df.index = pd.to_datetime(df.index)
aroon_up = df[‘aroon_up’]
aroon_down = df[‘aroon_down’]
return aroon_up, aroon_down
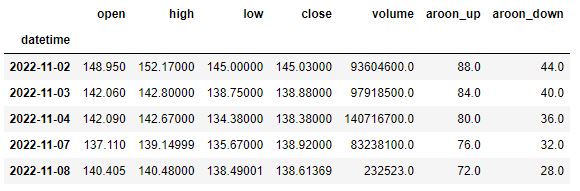
tsla[‘aroon_up’], tsla[‘aroon_down’] = get_aroon(myticker, mywin, mydate)
tsla.tail()
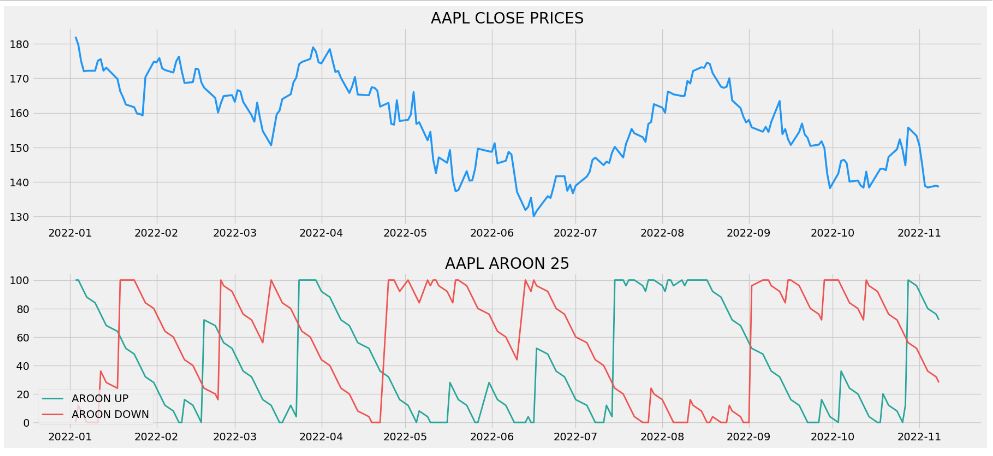
Let’s plot these 2 indicators below the closing price
ax1 = plt.subplot2grid((11,1), (0,0), rowspan = 5, colspan = 1)
ax2 = plt.subplot2grid((11,1), (6,0), rowspan = 4, colspan = 1)
ax1.plot(tsla[‘close’], linewidth = 2.5, color = ‘#2196f3’)
ax1.set_title(‘AAPL CLOSE PRICES’)
ax2.plot(tsla[‘aroon_up’], color = ‘#26a69a’, linewidth = 2, label = ‘AROON UP’)
ax2.plot(tsla[‘aroon_down’], color = ‘#ef5350’, linewidth = 2, label = ‘AROON DOWN’)
ax2.legend()
ax2.set_title(‘AAPL AROON 25’)
plt.show()
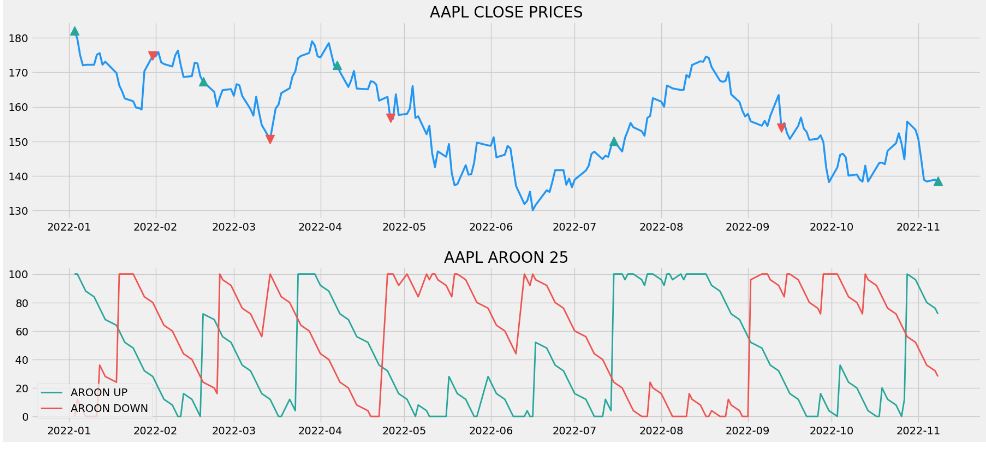
Let’s implement the Aroon trading strategy using the above plots
def implement_aroon_strategy(prices, up, down):
buy_price = []
sell_price = []
aroon_signal = []
signal = 0
for i in range(len(prices)):
    if up[i] >= 70 and down[i] <= 30:
        if signal != 1:
            buy_price.append(prices[i])
            sell_price.append(np.nan)
            signal = 1
            aroon_signal.append(signal)
        else:
            buy_price.append(np.nan)
            sell_price.append(np.nan)
            aroon_signal.append(0)
    elif up[i] <= 30 and down[i] >= 70:
        if signal != -1:
            buy_price.append(np.nan)
            sell_price.append(prices[i])
            signal = -1
            aroon_signal.append(signal)
        else:
            buy_price.append(np.nan)
            sell_price.append(np.nan)
            aroon_signal.append(0)
    else:
        buy_price.append(np.nan)
        sell_price.append(np.nan)
        aroon_signal.append(0)

return buy_price, sell_price, aroon_signal
buy_price, sell_price, aroon_signal = implement_aroon_strategy(tsla[‘close’], tsla[‘aroon_up’], tsla[‘aroon_down’])
Let’s plot the result
ax1 = plt.subplot2grid((11,1), (0,0), rowspan = 5, colspan = 1)
ax2 = plt.subplot2grid((11,1), (6,0), rowspan = 4, colspan = 1)
ax1.plot(tsla[‘close’], linewidth = 2.5, color = ‘#2196f3’)
ax1.plot(tsla.index, buy_price, marker = ‘^’, color = ‘#26a69a’, markersize = 12)
ax1.plot(tsla.index, sell_price, marker = ‘v’, color = ‘#ef5350’, markersize = 12)
ax1.set_title(‘AAPL CLOSE PRICES’)
ax2.plot(tsla[‘aroon_up’], color = ‘#26a69a’, linewidth = 2, label = ‘AROON UP’)
ax2.plot(tsla[‘aroon_down’], color = ‘#ef5350’, linewidth = 2, label = ‘AROON DOWN’)
ax2.legend()
ax2.set_title(‘AAPL AROON 25’)
plt.show()
We are ready to create our position
position = []
for i in range(len(aroon_signal)):
if aroon_signal[i] > 1:
position.append(0)
else:
position.append(1)
for i in range(len(tsla[‘close’])):
if aroon_signal[i] == 1:
position[i] = 1
elif aroon_signal[i] == -1:
position[i] = 0
else:
position[i] = position[i-1]
aroon_up = tsla[‘aroon_up’]
aroon_down = tsla[‘aroon_down’]
close_price = tsla[‘close’]
aroon_signal = pd.DataFrame(aroon_signal).rename(columns = {0:’aroon_signal’}).set_index(tsla.index)
position = pd.DataFrame(position).rename(columns = {0:’aroon_position’}).set_index(tsla.index)
frames = [close_price, aroon_up, aroon_down, aroon_signal, position]
strategy = pd.concat(frames, join = ‘inner’, axis = 1)
strategy
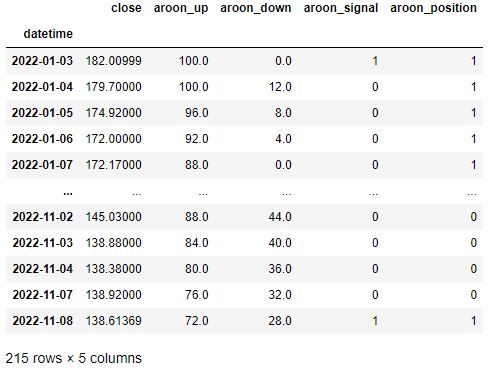
This list indicates 1 if we hold the stock or 0 if we don’t hold the stock. Our position will remain 0 until some changes in the trading signal occur. The Aroon indicator trading signal may also represent a sell signal (-1).
Let’s implement the backtesting process for our trading strategy
tsla_ret = pd.DataFrame(np.diff(tsla[‘close’])).rename(columns = {0:’returns’})
aroon_strategy_ret = []
for i in range(len(tsla_ret)):
returns = tsla_ret[‘returns’][i]*strategy[‘aroon_position’][i]
aroon_strategy_ret.append(returns)
aroon_strategy_ret_df = pd.DataFrame(aroon_strategy_ret).rename(columns = {0:’aroon_returns’})
investment_value = myamount
number_of_stocks = floor(investment_value/tsla[‘close’][-1])
aroon_investment_ret = []
for i in range(len(aroon_strategy_ret_df[‘aroon_returns’])):
returns = number_of_stocks*aroon_strategy_ret_df[‘aroon_returns’][i]
aroon_investment_ret.append(returns)
aroon_investment_ret_df = pd.DataFrame(aroon_investment_ret).rename(columns = {0:’investment_returns’})
total_investment_ret = round(sum(aroon_investment_ret_df[‘investment_returns’]), 2)
profit_percentage = floor((total_investment_ret/investment_value)*100)
print(cl(‘Profit gained from the Aroon strategy by investing $10k in AAPL: {}’.format(total_investment_ret), attrs = [‘bold’]))
print(cl(‘Profit percentage of the Aroon strategy : {}%’.format(profit_percentage), attrs = [‘bold’]))
Profit gained from the Aroon strategy by investing $10k in AAPL: -2561.76
Profit percentage of the Aroon strategy : -26%
Let’s see how well our trading strategy performs against a benchmark (SPY ETF)
def get_benchmark(start_date, investment_value):
spy = get_historical_data(‘SPY’, start_date)[‘close’]
benchmark = pd.DataFrame(np.diff(spy)).rename(columns = {0:’benchmark_returns’})
investment_value = investment_value
number_of_stocks = floor(investment_value/spy[-1])
benchmark_investment_ret = []

for i in range(len(benchmark['benchmark_returns'])):
    returns = number_of_stocks*benchmark['benchmark_returns'][i]
    benchmark_investment_ret.append(returns)

benchmark_investment_ret_df = pd.DataFrame(benchmark_investment_ret).rename(columns = {0:'investment_returns'})
return benchmark_investment_ret_df
benchmark = get_benchmark(mydate, myamount)
investment_value = myamount
total_benchmark_investment_ret = round(sum(benchmark[‘investment_returns’]), 2)
benchmark_profit_percentage = floor((total_benchmark_investment_ret/investment_value)*100)
print(cl(‘Benchmark profit by investing $10k : {}’.format(total_benchmark_investment_ret), attrs = [‘bold’]))
print(cl(‘Benchmark Profit percentage : {}%’.format(benchmark_profit_percentage), attrs = [‘bold’]))
print(cl(‘Aroon Strategy profit is {}% higher than the Benchmark Profit’.format(profit_percentage – benchmark_profit_percentage), attrs = [‘bold’]))
Benchmark profit by investing $10k : -2533.7
Benchmark Profit percentage : -26%
Aroon Strategy profit is 0% higher than the Benchmark Profit
We can see that our Aroon indicator trading strategy has outperformed the SPY ETF by 0%.
Summary
- The Aroon indicator is composed of two lines. An up line which measures the number of periods since a High, and a down line which measures the number of periods since a Low.
- The indicator is typically applied to 25 periods of data, so the indicator is showing how many periods it has been since a 25-period high or low.
- When the Aroon Up is above the Aroon Down, it indicates bullish price behavior (cf. 2022-04, -08, -11)
- When the Aroon Down is above the Aroon Up, it signals bearish price behavior (cf. 2022-02, -03, -05, -06, -09, -10).
- Crossovers of the two lines can signal trend changes. For example, when Aroon Up crosses above Aroon Down it may mean a new uptrend is starting.
- The road ahead: this indicator should be incorporated into the comprehensive investment/trading risk management and portfolio optimization workflows.
Explore More
Algorithmic Trading with Aroon Indicator in Python
Investment Risk Management Study
Supervised ML/AI Stock Prediction using Keras LSTM Models
Upswing Resilient Investor Guide
ML/AI Regression for Stock Prediction – AAPL Use Case
Short-Term Stock Market Price Prediction using Deep Learning Models
AAPL Stock Technical Analysis 2 June 2022
Stock Forecasting with FBProphet
Predicting Trend Reversal in Algorithmic Trading using Stochastic Oscillator in Python
S&P 500 Algorithmic Trading with FBProphet
Track All Markets with TradingView
Basic Stock Price Analysis in Python
Bear Market Similarity Analysis using Nasdaq 100 Index Data
Are Blue-Chips Perfect for This Bear Market?
Algorithmic Testing Stock Portfolios to Optimize the Risk/Reward Ratio
Macroaxis AI Investment Opportunity
Zacks Insights into this High Inflation/Rising Rate Market
Towards min(Risk/Reward) – SeekingAlpha August Bear Market Update
The Qullamaggie’s OXY Swing Breakouts
Stock Portfolio Risk/Return Optimization
Risk/Return QC via Portfolio Optimization – Current Positions of The Dividend Breeder
Portfolio Optimization Risk/Return QC – Positions of Humble Div vs Dividend Glenn
A TradeSanta’s Quick Guide to Best Swing Trading Indicators
Bear vs. Bull Portfolio Risk/Return Optimization QC Analysis
DJI Market State Analysis using the Cruz Fitting Algorithm
Zacks Investment Research Update Q4’22


Make a one-time donation
Make a monthly donation
Make a yearly donation
Choose an amount
Or enter a custom amount
Your contribution is appreciated.
Your contribution is appreciated.
Your contribution is appreciated.

Leave a comment