
Based upon the Cruz stochastic fitting algorithm and the colab code implementing a Hidden Markov Model, let’s predict the DJI stock returns from 1970 to 2022 and detect three states such as bull (green), sideways (yellow) and bear (red) markets.
Let’s set the working directory YOURPATH
import os
os.chdir(‘YOURPATH’)
os. getcwd()
and import/install the following libraries
!pip install hmmlearn
Successfully installed hmmlearn-0.2.8
import yfinance as yf
from datetime import date
import numpy as np
import pandas as pd
from hmmlearn import hmm
import matplotlib.pyplot as plt
plt.rcParams[‘figure.figsize’] = [16, 12]
Let’s download the historical dataset
stonks = [‘DJI’]
df = yf.download(stonks)
[*********************100%***********************] 1 of 1 completed
and create the new dataset
df[‘Log’] = np.log(df[‘Close’])
df[‘Returns’] = df[‘Log’].pct_change()
df[‘Range’] = (df[‘High’] / df[‘Low’]) – 1
df.dropna(inplace=True)
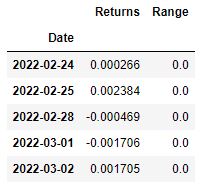
data = df[[‘Returns’, ‘Range’]]
data.head()
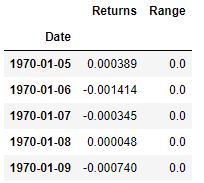
data.tail()
Let’s fit this dataset using the stochastic model hmm.GaussianHMM
model = hmm.GaussianHMM(n_components=3, covariance_type=’full’)
model.fit(data)
GaussianHMM(covariance_type='full', n_components=3)
model.score(data)
147312.57522273296
Let’s predict the market states
states = model.predict(data)
and plot the state histogram
pd.Series(states).hist()
plt.savefig(“cruzhiststates.png”)

Let’s plot the stock price coloured by the detected 3 states
state1,state2,state3 = [],[],[]
i = 0
for state in states:
if state == 0:
state1.append(df[‘Close’][i])
state2.append(float(‘nan’))
state3.append(float(‘nan’))
if state == 1:
state2.append(df[‘Close’][i])
state1.append(float(‘nan’))
state3.append(float(‘nan’))
if state == 2:
state3.append(df[‘Close’][i])
state2.append(float(‘nan’))
state1.append(float(‘nan’))
i += 1
plt.plot(state1,color=’green’)
plt.plot(state2,color=’yellow’)
plt.plot(state3,color=’red’)
plt.savefig(“cruzplotstates.png”)
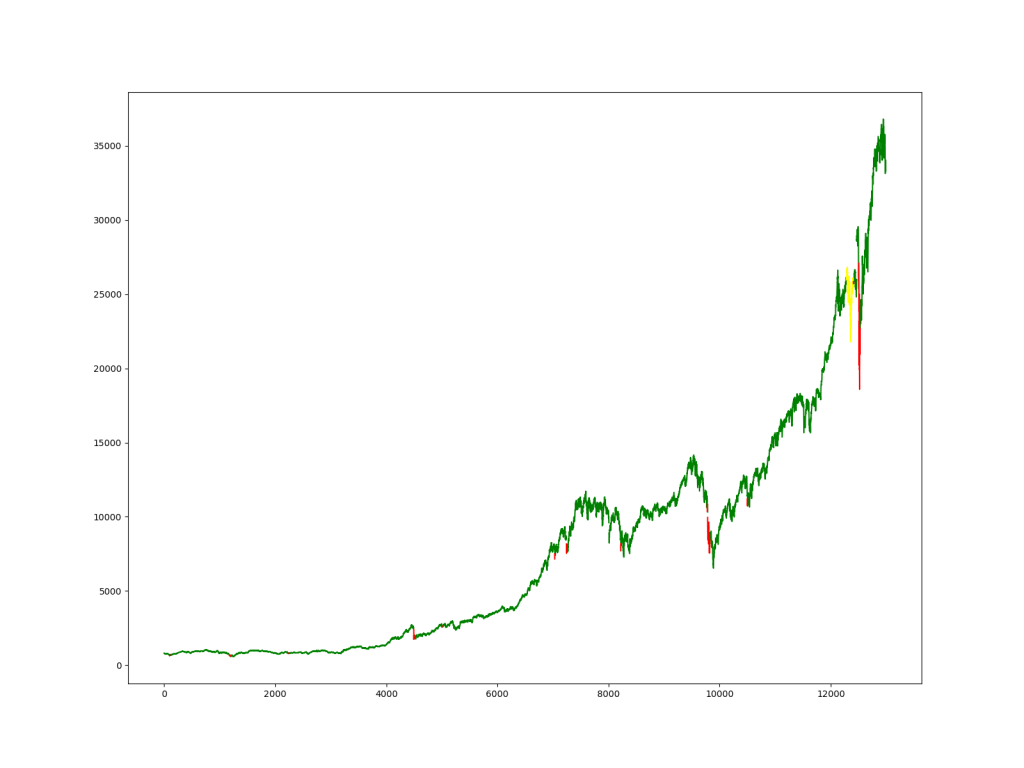
Here, the horizontal axis represents the time index in the range [1970-01-05 – 2022-03-02].
The above plot is a stochastic indicator of the underlying market state: bull (green), sideways (yellow) and bear (red) markets.
Explore More
- BTC-USD Price Prediction with LSTM Keras
- Zacks Investment Research Update Q4’22
- Bear vs. Bull Portfolio Risk/Return Optimization QC Analysis
- A TradeSanta’s Quick Guide to Best Swing Trading Indicators
- The Zacks’s Steady Investor – A Quick Look
- Risk/Return POA – Dr. Dividend’s Positions
- Portfolio Optimization Risk/Return QC – Positions of Humble Div vs Dividend Glenn
- Risk/Return QC via Portfolio Optimization – Current Positions of The Dividend Breeder
- Stock Portfolio Risk/Return Optimization
- The Qullamaggie’s OXY Swing Breakouts
- The Qullamaggie’s TSLA Breakouts for Swing Traders
- SeekingAlpha Risk/Reward July Rundown
- Zacks Insights into the Commodity Bull Market
- Algorithmic Testing Stock Portfolios to Optimize the Risk/Reward Ratio
- Algorithmic Trading using Monte Carlo Predictions and 62 AI-Assisted Trading Technical Indicators (TTI)
- Are Blue-Chips Perfect for This Bear Market?
- Bear Market Similarity Analysis using Nasdaq 100 Index Data
- Basic Stock Price Analysis in Python
- S&P 500 Algorithmic Trading with FBProphet
- Predicting Trend Reversal in Algorithmic Trading using Stochastic Oscillator in Python
- Inflation-Resistant Stocks to Buy
- Short-Term Stock Market Price Prediction using Deep Learning Models
- ML/AI Regression for Stock Prediction – AAPL Use Case
- Stocks on Watch Tomorrow
- Investment Risk Management Study
- RISK AWARE INVESTMENT: GUIDE FOR EVERYONE
- Macroaxis Wealth Optimization
- Upswing Resilient Investor Guide
- A Weekday Market Research Update


Make a one-time donation
Make a monthly donation
Make a yearly donation
Choose an amount
Or enter a custom amount
Your contribution is appreciated.
Your contribution is appreciated.
Your contribution is appreciated.
DonateDonate monthlyDonate yearly
Leave a comment