
In the last decade, the impact of Type-2 Diabetes (T2D) has increased to a great extent especially in developing countries. T2D is a common condition that causes the level of sugar (glucose) in the blood to become too high. T2D is responsible for very considerable morbidity, mortality.
The objective of this project is to summarize recent efforts to use ML/AI techniques to assist in the management of T2D, along with the associated challenges.
Our results indicate that ML methods are being progressively established as suitable for use in clinical daily practice, as well as for the self-management of diabetes. Consequently, these methods provide powerful tools for improving patients’ quality of life.
Contents:
- State-of-the-Art
- Public-Domain Data Analysis
- ML/AI T2D Use-Cases
- Lifestyle & Daily-Life Support
- Key Takeaways
- Explore More
- References

State-of-the-Art
The potential of AI to enable T2D solutions has been investigated in the context of multiple critical management issues. In this case study, we use the following proposed T2D management categories to summarize the latest 3 contributions described in the reviewed articles:
- Blood glucose control/prediction
- Risk and patient personalization
- Lifestyle and daily-life support in T2D management
Over the last years, various ML/AI techniques (DNN, SVM, KNN, DT, GBT, GBM, RF, LR, etc.) have been used to predict T2D and its complications. However, researchers and developers still face two main challenges when building T2D predictive models:
- There is considerable heterogeneity in previous studies regarding algorithms used, making it challenging to identify the optimal one.
- There is a lack of transparency about the features used in the optimized models, which reduces their interpretability.
- This systematic analysis aimed at providing answers to the above challenges.
- The study followed the earlier review primarily, enriched with the most recent case studies (cf. References and Explore More).
Public-Domain Data Analysis
Conventionally, T2D ML/AI studies use the Kaggle PIMA Indian Diabetes (PID) dataset taken from the National Institute of Diabetes and Kidney Diseases center, see UC Irvine Machine Learning Repository. The objective of the dataset is to diagnostically predict whether or not a patient has diabetes, based on certain diagnostic measurements included in the dataset. Several constraints were placed on the selection of these instances from a larger database. In particular, all patients here are females at least 21 years old of Pima Indian heritage.
Dataset 1: 768 Females of Pima Indian Heritage
The PIMA dataset consists of several medical predictor variables and one target variable, Outcome. Predictor variables includes the number of pregnancies the patient has had, their BMI, insulin level, age, and so on:
- Pregnancies: Number of times pregnant
- Glucose: Plasma glucose concentration a 2 hours in an oral glucose tolerance test
- BloodPressure: Diastolic blood pressure (mm Hg)
- SkinThickness: Triceps skin fold thickness (mm)
- Insulin: 2-Hour serum insulin (mu U/ml)
- BMI: Body mass index (weight in kg/(height in m)^2)
- DiabetesPedigreeFunction: Diabetes pedigree function
- Age: Age (years)
- Outcome: Class variable (0 or 1)
An interesting attribute is the Diabetes Pedigree Function (pedi). It provided some data on T2D history in relatives and the genetic relationship of those relatives to the patient (the hereditary risk).
RangeIndex: 768 entries, 0 to 767
Data columns (total 9 columns):
 #   Column                    Non-Null Count  Dtype
---  ------                    --------------  -----
 0   Pregnancies               768 non-null    int64
 1   Glucose                   768 non-null    int64
 2   BloodPressure             768 non-null    int64
 3   SkinThickness             768 non-null    int64
 4   Insulin                   768 non-null    int64
 5   BMI                       768 non-null    float64
 6   DiabetesPedigreeFunction  768 non-null    float64
 7   Age                       768 non-null    int64
 8   Outcome                   768 non-null    int64
dtypes: float64(2), int64(7)
memory usage: 54.1 KB
Let’s count the number of zero values
Pregnancies                   0
Glucose                       5
BloodPressure                35
SkinThickness               227
Insulin                     374
BMI                          11
DiabetesPedigreeFunction      0
Age                           0
Outcome                       0
to be replaced by mean/median values per column.
The ML objective (binary classification problem) is to predict if the patient is diabetic or not (Outcome=0, 1).
In principle, we can rename the column names using the description from the original dataset website
[“NumTimesPrg”, “PlGlcConc”, “BloodP”, “SkinThick”, “TwoHourSerIns”, “BMI”, “DiPedFunc”, “Age”, “HasDiabetes”]

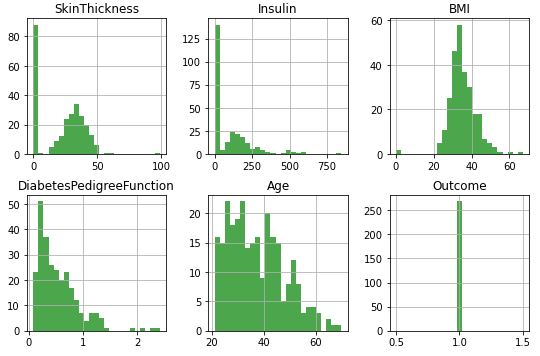
Histograms of input data columns:

The BMI density plot:

The BMI vs Glucose scatter plot:

The composite BMI-Glucose-Age scatter plot:
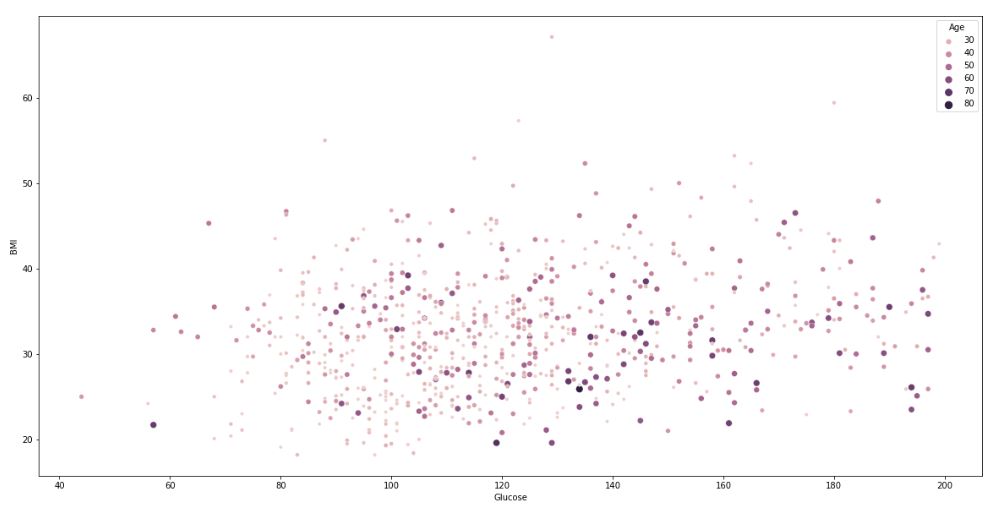
It is clear that the PIMA population is generally young, less than 50 years old.
Recall that the boxplot is drawn from the first quartile to the third quartile. The line inside the box represents the median. The whiskers extend from both ends of the box to the minimum and maximum values. So a boxplot and whisker plot is a type of distribution graph — it shows how the data is dispersed around the median, if the data is skewed, and whether or not it is symmetrical.

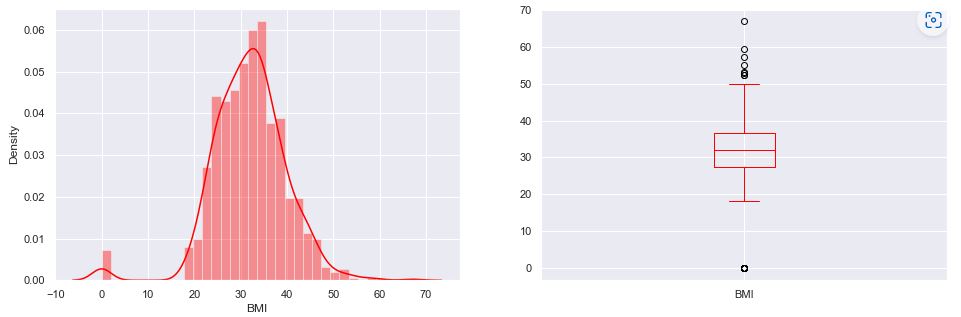

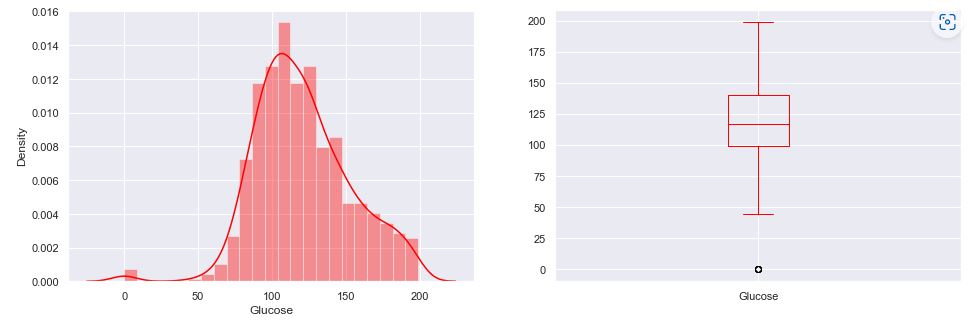
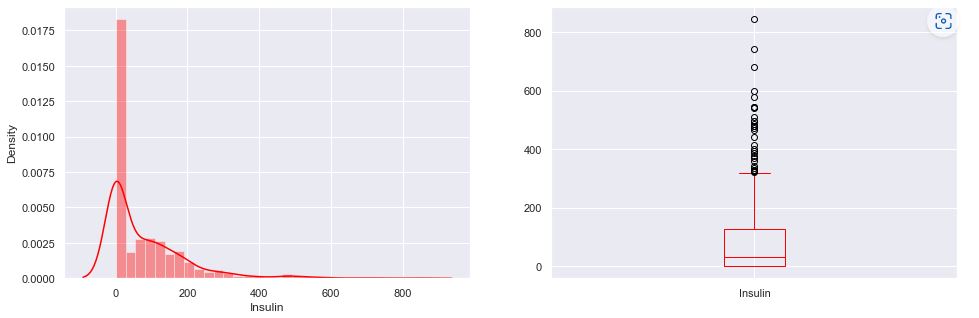

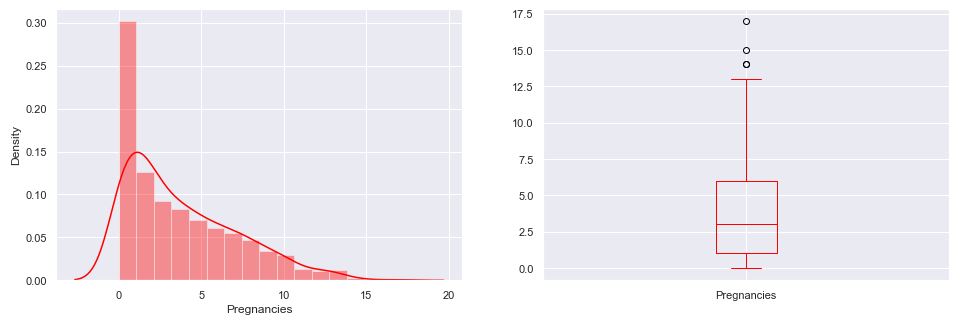
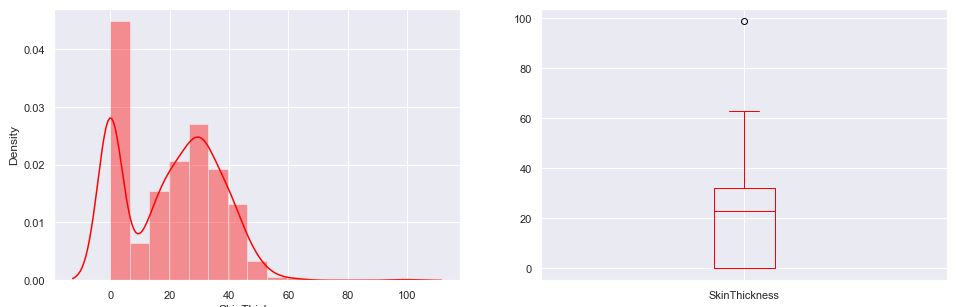
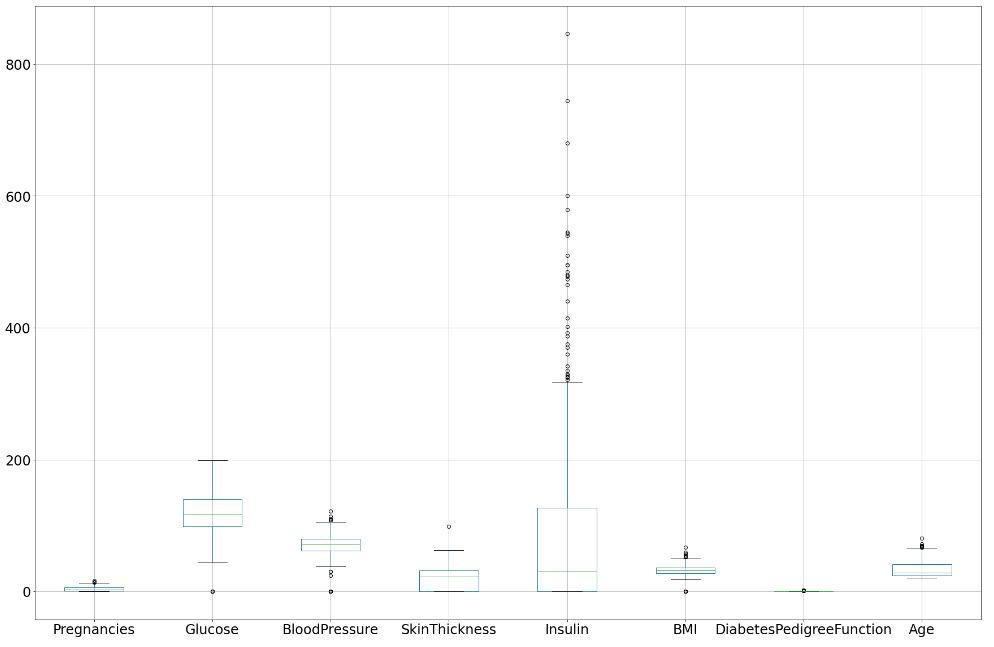
Let’s check skewness of Insulin, Skin Thickness, and Age. It indicates that the data may not be normally distributed. Outliers, which are data values that are far away from other data values, can strongly affect ML results. Outliers are easiest to identify on the boxplots above (cf. Insulin and DPF).
We can also group our data based on Outcome
Outcome
0    500
1    268
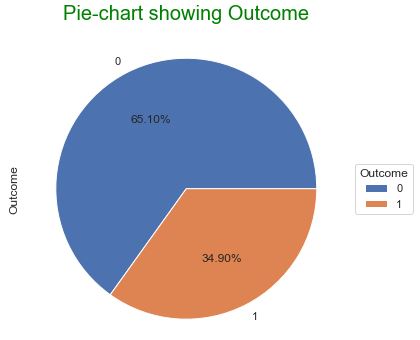
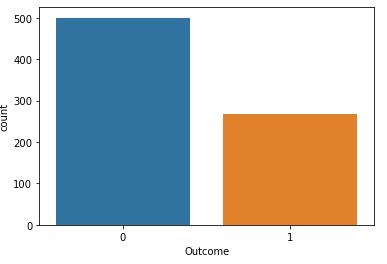
Upon examining the distribution of class values (see above 2 plots), we noticed that there are 500 negative instances (65.1%) and 258 positive instances (34.9%).
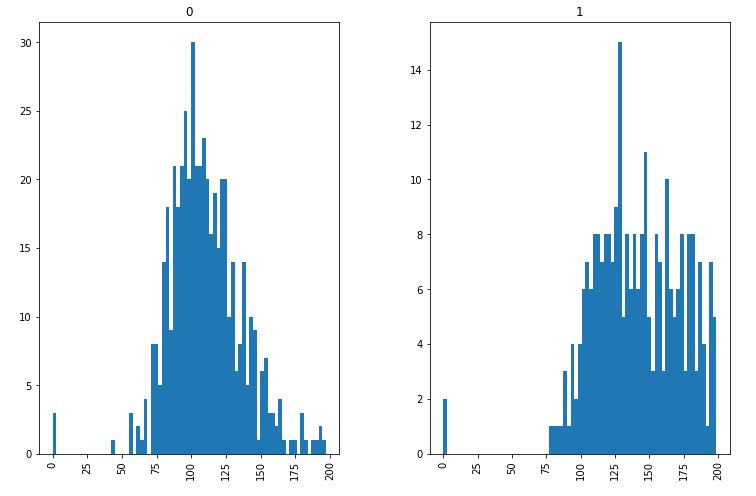


Reviewing histograms of all attributes in the dataset shows us the following:
- Some of the attributes look normally distributed (plas, pres, skin, and mass).
- Some of the attributes look like they may have an exponential distribution (preg, insu, pedi, age).
- Age should probably have a normal distribution, the constraints on the data collection may have skewed the distribution.
- Testing for normality (normality plot) may be of interest. We could look at fitting the data to a normal distribution.
Reviewing scatter plots of all attributes in the dataset shows that:
- There is no obvious relationship between age and onset of diabetes.
- There is no obvious relationship between pedi function and onset of diabetes.
- This may suggest that diabetes is not hereditary, or that the Diabetes Pedigree Function needs work.
- Larger values of plas combined with larger values for age, pedi, mass, insu, skin, pres, and preg tends to show greater likelihood of testing positive for diabetes.
All X-plots, histograms and density plots above suggest that the difference between two means grouped by Overcome is not statistically significant. Since those intervals overlap, we conclude that the difference between 2 groups is not statistically significant. If there is no overlap or overlap < 25%, the difference is significant.
While this visual method of assessing the overlap is easy to perform, regrettably it comes at the cost of reducing our ability to detect differences. This is where ML comes in.
It is important to consider all possible limitations of the data, which may include the following:
- Results may be limited to Pima Indians, but give us a good start on how to begin diagnosing other populations with diabetes.
- Results may be limited to the time the data was collected (between 1960s and 1980s). Today’s medical procedures for diagnosing diabetes include a urine test and the hemoglobin A1c test, which shows the average level of blood sugar over the previous 3 months.
- Dataset is rather small, which may limit performance of some ML algorithms.
Dataset 2: the diabetes dataset which is available from within scikit-learn.
from sklearn.datasets import load_diabetes
Diabetes dataset
----------------

Ten baseline variables, age, sex, body mass index, average blood
pressure, and six blood serum measurements were obtained for each of n =
442 diabetes patients, as well as the response of interest, a
quantitative measure of disease progression one year after baseline.

**Data Set Characteristics:**

  :Number of Instances: 442

  :Number of Attributes: First 10 columns are numeric predictive values

  :Target: Column 11 is a quantitative measure of disease progression one year after baseline

  :Attribute Information:
      - age     age in years
      - sex
      - bmi     body mass index
      - bp      average blood pressure
      - s1      tc, total serum cholesterol
      - s2      ldl, low-density lipoproteins
      - s3      hdl, high-density lipoproteins
      - s4      tch, total cholesterol / HDL
      - s5      ltg, possibly log of serum triglycerides level
      - s6      glu, blood sugar level

Note: Each of these 10 feature variables have been mean centered and scaled by the standard deviation times `n_samples` (i.e. the sum of squares of each column totals 1).

Source URL:
https://www4.stat.ncsu.edu/~boos/var.select/diabetes.html

For more information see:
Bradley Efron, Trevor Hastie, Iain Johnstone and Robert Tibshirani (2004) "Least Angle Regression," Annals of Statistics (with discussion), 407-499.
(https://web.stanford.edu/~hastie/Papers/LARS/LeastAngle_2002.pdf)
ML/AI T2D Use-Cases
Feature Selection is the process used to select the input variables that are most important to your Machine Learning task.
Dataset 1
RFC classification report:
[[137  25]
 [ 31  61]]
              precision    recall  f1-score   support

           0       0.82      0.85      0.83       162
           1       0.71      0.66      0.69        92

    accuracy                           0.78       254
   macro avg       0.76      0.75      0.76       254
weighted avg       0.78      0.78      0.78       254
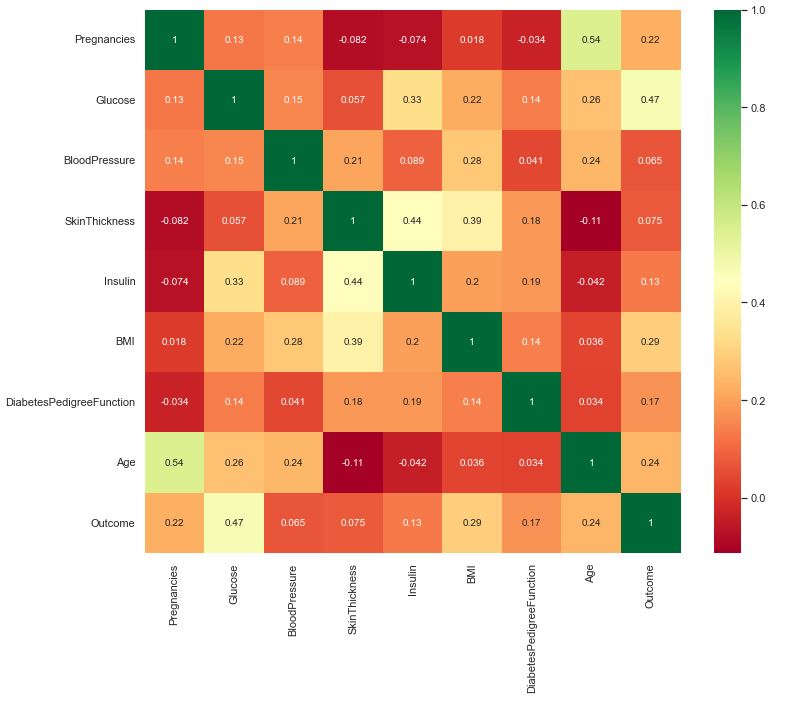
The feature correlation matrix C=C(*,*) below is simply a table which displays the correlation coefficients for different variables. The matrix depicts the correlation between all the possible pairs of values in a table. Each cell in the table below contains the Pearson correlation coefficient.
The feature importance plots below provide a score that indicates how useful or valuable each feature was in the training of the specific ML model. This importance is calculated explicitly for each attribute in the dataset, allowing attributes to be ranked and compared to each other.
RFC Feature ranking below: 1 – Glucose, 2 – BMI, 3- Age, 4 – DPF, 5 – BP.

GBC Feature ranking below: 1 – Glucose, 2 – BMI, 3- Age, 4 – DPF, 5 – Pregnancies.

DTC Feature ranking below: 1 – Glucose, 2 – BMI, 3 – Pregnancies.

Improved RFC Feature ranking below: 1 – Glucose, 2 – BMI, 3- DPF, 4 – Age, 5 – BP.


We can see that RFC yields the most accurate prediction of our test data. It offers the following feature ranking: 1 – Glucose, 2 – BMI, 3- DPF/Age. This is consistent with ranking based on the correlation coefficient (see the matrix C above):
C(Outcome, Glucose)=0.47 > C(Outcome, BMI)=0.29 > C(Outcome, Age)=0.24 ~ C(Outcome, Pregnancies).
In addition, we can drop Age or Pregnancies because C(Age, Pregnancies)=0.54. We can also drop Skin Thickness (ST) because C(ST, Insulin)=0.44 and
C(ST, BMI)=0.39. In principle, we can also drop Insulin because C(Insulin, Glucose)=0.33.
Dataset 2

Model features:
      - age     age in years
      - sex
      - bmi     body mass index
      - bp      average blood pressure
      - s1      tc, total serum cholesterol
      - s2      ldl, low-density lipoproteins
      - s3      hdl, high-density lipoproteins
      - s4      tch, total cholesterol / HDL
      - s5      ltg, possibly log of serum triglycerides level
      - s6      glu, blood sugar level
from sklearn.feature_selection import SelectFromModel
Features selected by SelectFromModel: ['s1' 's5']
Done in 0.001s
Our visual inspection of the above feature dominance plot suggests the following ranking: 1 – s1 (TC) ~ s5 (LTG), 2 – BMI, 3 -s2 (LDL).
Lifestyle & Daily-Life Support
Lifestyle & Daily-Life Support is a fundamental aspect of T2D risk management. ML/AI promotes a research-based, structured lifestyle change program that is proven to help prevent and delay the development of T2D.
You cannot change certain risk factors like your age but you can change some lifestyle risks including
- Being overweight with a large BMI
- Lack of physical activity
- An unhealthy diet
- Smoking
- High blood cholesterol
- High blood pressure
- Stress
Lifestyle changes are often advised for people at higher risk of diabetes and those who are newly diagnosed with type 2, to help manage their diabetes.
The recommended lifestyle interventions include:
- Taking two and a half hours each week of moderate intensity physical activity or one hour and 15 minutes of high intensity exercise.
- Losing weight gradually to achieve a healthy body mass index
- Replacing refined carbohydrates with wholegrain foods and increase intake of vegetables and other foods high in dietary fibre
- Reducing the amount of saturated fat in the diet.
Key Takeaways
- We have explored the Pima India Dataset 1 and the sklearn diabetes dataset 2 with many visualizations, feature engineering and numerical co-rendering.
- Results support the tight glycemic control strategy that attempts to rigidly control glucose levels (typically an A1C level of 6.5% to 7.0% or lower).
- This study shows that the more weight you lose, the greater the health benefits. Patients need to follow diabetes diet plans to lose weight.
- Our DPF feature analysis indicates the following: if you have a family health history of diabetes, you are more likely to have prediabetes and develop diabetes.
- Even though the PIMA population is generally young, there is evidence that the likelihood of developing the condition increases drastically after age 45.
- The second case study using dataset 2 supports the strong quasi-linear relationship between “bad” cholesterol and T2D, known as diabetic dyslipidemia.
- The studies offer support for the management of T2D patients using advanced features, such as computerized alerts.
- Recommendations have been proposed for improving daily-life support for diabetes therapies.
- Our findings show the increasing overall importance of ML/AI for T2D risk management.
- Future work: examine T2D medication adherence thresholds and risk of hospitalization to be implemented with the help of proposed ML/AI algorithms.
Explore More
References
- Artificial Intelligence for Diabetes Management and Decision Support: Literature Review
- Early detection of type 2 diabetes mellitus using machine learning-based prediction models
- Machine learning and deep learning predictive models for type 2 diabetes: a systematic review
- Predict Diabetes with Python (Starter Kernel)
- Diabetes Prediction in Python – A Simple Guide
- The Use of Machine Learning Approaches in Clinical Research of Diabetes
- Weight loss and diabetes
- Feature Importance and Feature Selection With XGBoost in Python
- Predicting Diabetes with Random Forest Classifier
- Machine Learning: Pima Indians Diabetes
- Machine Learning Workflow on Diabetes Data : Part 02
- End-to-End Data Science Example: Predicting Diabetes with Logistic Regression
- 21 Easy Diabetic-Friendly Recipes To Try This Season
- Healthy Diabetes-Friendly Recipes
- Diabetic Diet – 16-Week Personalized Course
- 8 Exercise Ideas for Seniors Managing Diabetes


Make a one-time donation
Make a monthly donation
Make a yearly donation
Choose an amount
Or enter a custom amount
Your contribution is appreciated.
Your contribution is appreciated.
Your contribution is appreciated.

Leave a comment