
Based upon the Portfolio Optimization Algorithm (POA) discussed earlier and the relevant POA QC analysis and comparisons, let’s look at the current stock positions suggested by Dr. Dividend (DD).
Let’s define the following POA parameters:
benchmark_ = [“^GSPC”,]
portfolio_ = [‘AAPL’, ‘GOOG’, ‘COST’, ‘SBUX’, ‘DE’,’SOFI’,’APD’,’UNH’,’SHW’,’NVDA’]
start_date_ = “2021-01-01”
end_date_ = “2022-10-05”
number_of_scenarios = 10000
trade_days_per_year = 252
delta_risk = 0.1
We read the input stock data

The POA output is as follows:
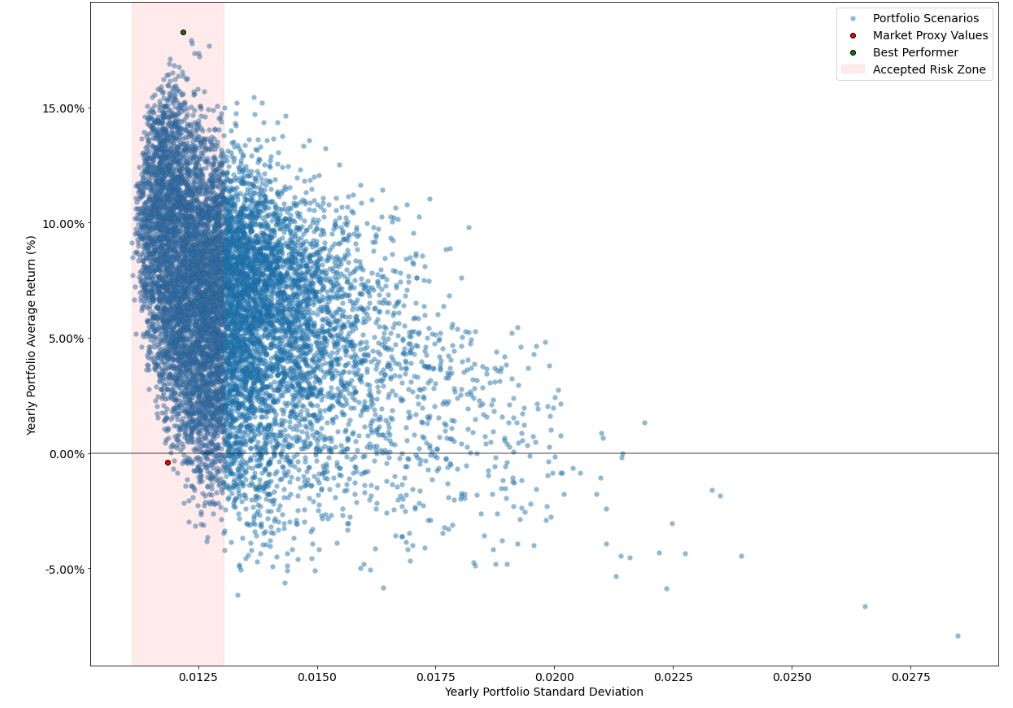
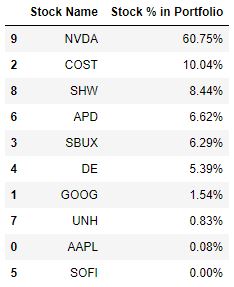
It is clear that
- the DD best performer offers a similar risk level as the market proxy
- the relatively low DD risk level is well within the expected boundaries
- Return(DD) ~ +18% while Return(^GSPC) ~-0.5%.
- The optimized DD portfolio may exclude UNH, AAPL, and SOFI stocks.


One-Time
Monthly
Yearly
Make a one-time donation
Make a monthly donation
Make a yearly donation
Choose an amount
€5.00
€15.00
€100.00
€5.00
€15.00
€100.00
€5.00
€15.00
€100.00
Or enter a custom amount
€
Your contribution is appreciated.
Your contribution is appreciated.
Your contribution is appreciated.
DonateDonate monthlyDonate yearly
Leave a comment