
- Microsoft (MS) Excel is frequently used for data analysis across a range of industries, including banking, healthcare, and marketing, thanks to its versatility and usability.
- Although Excel is proprietary software from MS, there are free alternatives that run on Windows, OS X, and Linux.
- This article aims to demonstrate A-Z automation of repetitive tasks and reports in Excel.
- In practice, Excel offers automation through the use of third-party programs like Python or the built-in programming language VBA.
- When it comes to automating, Python is faster and can handle significantly bigger datasets than VBA. Besides, VBA is restricted to Microsoft Office automation, but Python may run on any operating system and be used for a wide range of tasks.
- Referring to the Python Excel tutorial in the sequel, we will be using the Kaggle’s Video Game Sales dataset.
- Our objective is to test the
openpyxllibrary that allows our Python programs to read and modify Excel spreadsheet files. - This library can help you write functions, format spreadsheets, create reports, and build charts directly in Python without even having to open an Excel application.
Clickable Table of Contents
- Excel-to-Python Data Import
- Getting Data from Cells
- Writing to Excel Files
- Creating New Columns
- Appending New Rows
- Implementing Excel Formulas
- Working with Sheets
- Adding Basic Charts
- Formatting Cells
- Conclusions
- References
- Explore More
Excel-to-Python Data Import
Let’s set the working directory YOURPATH
import os
os.chdir('YOURPATH')  # Set working directory
os. getcwd()
and install openpyxl
!pip install openpyxl
If the module was correctly installed, this should produce no error messages.
Once we’ve imported the openpyxl module, we’ll be able to use the openpyxl.load_workbook() function
import openpyxl
wb = openpyxl.load_workbook('videogamesales.xlsx')
This function takes in the filename and returns a value of the workbook data type. Remember that *.xlsx needs to be in the current working directory YOURPATH in order to work with it.
Let’s tell the library which worksheet to access:
call the active worksheet (the 1st sheet in the workbook)
ws = wb.active
or access the “vgsales” worksheet
ws = wb['vgsales']
Let’s count the number of rows and columns in this worksheet
print('Total number of rows: '+str(ws.max_row)+'. And total number of columns: '+str(ws.max_column))
Output:
Total number of rows: 16328. And total number of columns: 10
Let’s learn how to access cells from the workbook.
Getting Data from Cells
Let’s look at the active sheet vgsales

Enter the following into the interactive shell
print('The value in cell A1 is: '+ws['A1'].value)
Output:
The value in cell A1 is: Rank
The Cell object has a value attribute that contains the value stored in that cell. Cell objects also have row, column, and coordinate attributes that provide location information for the cell.
Let’s print out all the values in the first row
values = [ws.cell(row=1,column=i).value for i in range(1,ws.max_column+1)]
print(values)
Output:
['Rank', 'Name', 'Platform', 'Year', 'Genre', 'Publisher', 'NA_Sales', 'EU_Sales', 'JP_Sales', 'Other_Sales']
As an example, let’s print out first 10 rows in the 2nd column (B)
data=[ws.cell(row=i,column=2).value for i in range(2,12)]
print(data)
Output:
['Wii Sports', 'Super Mario Bros.', 'Mario Kart Wii', 'Wii Sports Resort', 'Pokemon Red/Pokemon Blue', 'Tetris', 'New Super Mario Bros.', 'Wii Play', 'New Super Mario Bros. Wii', 'Duck Hunt']
Let’s read a range of cells (e.g., columns 1-6)
my_list = list()

for value in ws.iter_rows(
    min_row=1, max_row=11, min_col=1, max_col=6,
    values_only=True):
    my_list.append(value)

for ele1,ele2,ele3,ele4,ele5,ele6 in my_list:
    (print ("{:<8}{:<35}{:<10} {:<10}{:<15}{:<15}".format(ele1,ele2,ele3,ele4,ele5,ele6)))
Output:
Rank    Name                               Platform   Year      Genre          Publisher
1       Wii Sports                         Wii        2006      Sports         Nintendo
2       Super Mario Bros.                  NES        1985      Platform       Nintendo
3       Mario Kart Wii                     Wii        2008      Racing         Nintendo
4       Wii Sports Resort                  Wii        2009      Sports         Nintendo
5       Pokemon Red/Pokemon Blue           GB         1996      Role-Playing   Nintendo
6       Tetris                             GB         1989      Puzzle         Nintendo
7       New Super Mario Bros.              DS         2006      Platform       Nintendo
8       Wii Play                           Wii        2006      Misc           Nintendo
9       New Super Mario Bros. Wii          Wii        2009      Platform       Nintendo
10      Duck Hunt                          NES        1984      Shooter        Nintendo
Generally, to get all the rows of the worksheet we use the method worksheet.rows and to get all the columns of the worksheet we use the method worksheet.columns. Similarly, to iterate only through the values we use the method worksheet.values.
Writing to Excel Files
You can always access the cell directly by using its key
ws['K1'] = 'Sum of Sales'
or by defining the row-column position of the cell
ws.cell(row=1, column=11, value = 'Sum of Sales')
Output:
<Cell 'vgsales'.K1>
You can update an Excel file with openpyxl
wb.save('videogamesales.xlsx')
Always make sure to close the Excel file before saving your changes!
Creating New Columns
Let’s add the sum of sales in every region and write it to column K
row_position = 2
col_position = 7

total_sales = ((ws.cell(row=row_position, column=col_position).value)+
               (ws.cell(row=row_position, column=col_position+1).value)+
               (ws.cell(row=row_position, column=col_position+2).value)+
               (ws.cell(row=row_position, column=col_position+3).value))

ws.cell(row=2,column=11).value=total_sales
wb.save('videogamesales.xlsx')
One can see that the total sales of vgsales have been calculated in cell K2 below
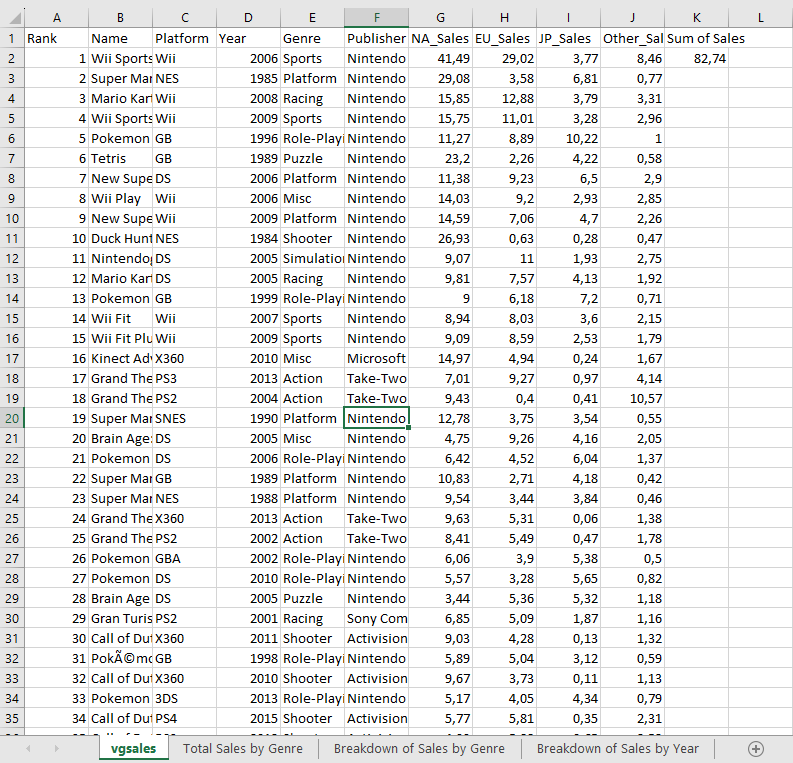
Similarly, we can create a sum of sales in every row
row_position = 1

for i in range(1, ws.max_row):

    row_position += 1
    NA_Sales = ws.cell(row=row_position, column=7).value
    EU_Sales = ws.cell(row=row_position, column=8).value
    JP_Sales = ws.cell(row=row_position, column=9).value
    Other_Sales = ws.cell(row=row_position, column=10).value

    total_sales = (NA_Sales + EU_Sales + JP_Sales + Other_Sales)
    ws.cell(row=row_position, column=11).value = total_sales

wb.save("videogamesales.xlsx")
The corresponding Excel file should now have a new column K reflecting the total sales of video games in all regions

Appending New Rows
To append a new row to the workbook, we simply create a tuple with the values we’d like to include and write it to the sheet
new_row = (1,'The Legend of Zelda',1986,'Action','Nintendo',3.74,0.93,1.69,0.14,6.51,6.5)

ws.append(new_row)

wb.save('videogamesales.xlsx')
We can confirm that this data has been appended by printing the last row in the workbook
values = [ws.cell(row=ws.max_row,column=i).value for i in range(1,ws.max_column+1)]
print(values)
The corresponding Excel file is as follows

To delete the new row we just created, we can run the following line of code
ws.delete_rows(ws.max_row, 1) # row number, number of rows to delete

wb.save('videogamesales.xlsx')
The first argument in the delete_rows() function is the row number you want to delete. The second argument indicates the number of rows that should be deleted.
Implementing Excel Formulas
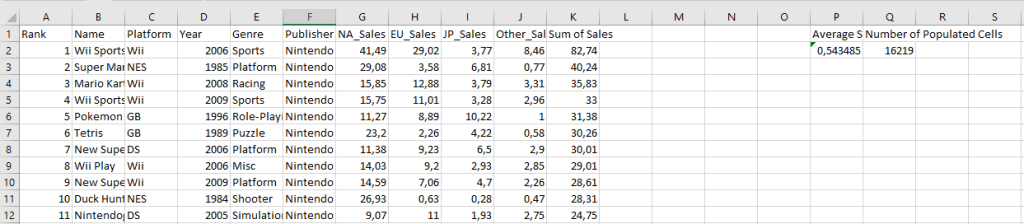
Let’s create a new column called “Average Sales” to calculate the average total video game sales in all markets
ws['P1'] = 'Average Sales'
ws['P2'] = '= AVERAGE(K2:K16220)'

wb.save('videogamesales.xlsx')
The average sales across all markets is approximately 0.54. This will be printed in cell P2 of our worksheet

The “COUNTA” function in Excel counts cells that are populated within a specific range. Let’s use it to find the number of records between E2 and E16220
ws['Q1'] = "Number of Populated Cells"
ws['Q2'] = '=COUNTA(E2:E16220)'

wb.save('videogamesales.xlsx')
The updated Excel worksheet is as follows
Let’s look at COUNTIF that counts the number of cells that meet a specific condition. We can use it to count the number of games in this dataset with the “Sports” genre
ws['R1'] = 'Number of Rows with Sports Genre'
ws['R2'] = '=COUNTIF(E2:E16220, "Sports")'

wb.save('videogamesales.xlsx')
The updated Excel worksheet contains the new cells R1 and R2

There are 2296 sports games in the dataset.
Let’s find the total “Sum of Sales” generated by sports games using the SUMIF function
ws['S1'] = 'Total Sports Sales'
ws['S2'] = '=SUMIF(E2:E16220, "Sports",K2:K16220)'

wb.save('videogamesales.xlsx')
The updated Excel worksheet contains the new cells S1 and S2

The Total Sports Sales is 1308,76.
Let’s calculate Rounded Sum of Sports Sales (cell S2) using CEILING
ws['T1'] = 'Rounded Sum of Sports Sales'
ws['T2'] = '=CEILING(S2,25)'

wb.save('videogamesales.xlsx')
The updated Excel file containing cells T1 and T2 is

The Rounded Sum of Sports Sales is 1325.
Working with Sheets
Let’s print the name of the active sheet
print(ws.title)
Output:
vgsales
Let’s rename this worksheet
ws.title ='Video Game Sales Data'

wb.save('videogamesales.xlsx')
The name of the active sheet should now be changed to “Video Game Sales Data.”
Let’s print out all the worksheets in the workbook
print(wb.sheetnames)
Output:
['Video Game Sales Data', 'Total Sales by Genre', 'Breakdown of Sales by Genre', 'Breakdown of Sales by Year']
Let’s create a new empty worksheet and print out all the worksheets in the workbook
wb.create_sheet('Empty Sheet') # create an empty sheet
print(wb.sheetnames) # print sheet names again

wb.save('videogamesales.xlsx')
Output:
['Video Game Sales Data', 'Total Sales by Genre', 'Breakdown of Sales by Genre', 'Breakdown of Sales by Year', 'Empty Sheet']
Let’s delete this worksheet and print out all the worksheets in the workbook
wb.remove(wb['Empty Sheet'])
print(wb.sheetnames)

wb.save('videogamesales.xlsx')
Output:
['Video Game Sales Data', 'Total Sales by Genre', 'Breakdown of Sales by Genre', 'Breakdown of Sales by Year']
Let’s create a copy of the worksheet “Video Game Sales Data”
wb.copy_worksheet(wb['Video Game Sales Data'])
wb.save('vgsales_2.xlsx')
We can get the required worksheet
ws = wb['Total Sales by Genre'] # access the required worksheet
Adding Basic Charts
Let’s build charts in Excel directly from Python.
- Bar Chart
# Values for plotting
from openpyxl.chart import Reference
values = Reference(ws, # worksheet object
min_col=2, # minimum column where your values begin
max_col=2, # maximum column where your values end
min_row=1, # minimum row you’d like to plot from
max_row=13) # maximum row you’d like to plot from
cats = Reference(ws,
min_col=1,
max_col=1,
min_row=2,
max_row=13)
from openpyxl.chart import BarChart
chart = BarChart()
chart.add_data(values, titles_from_data=True)
chart.set_categories(cats)
# set the title of the chart
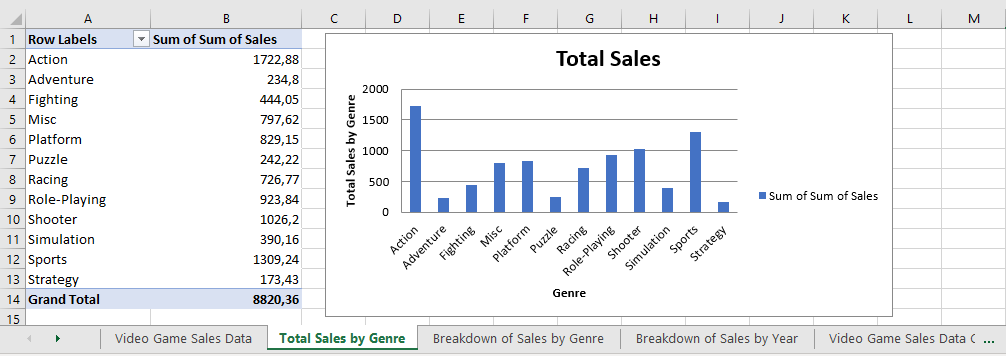
chart.title = "Total Sales"
# set the title of the x-axis
chart.x_axis.title = "Genre"
# set the title of the y-axis
chart.y_axis.title = "Total Sales by Genre"
# the top-left corner of the chart
# is anchored to cell F2 .
ws.add_chart(chart,"D2")
# save the file
wb.save("videogamesales.xlsx")
Output:
- Grouped Bar Chart
ws = wb['Breakdown of Sales by Genre'] # access worksheet
# Data for plotting
values = Reference(ws,
min_col=2,
max_col=5,
min_row=1,
max_row=13)
cats = Reference(ws, min_col=1,
max_col=1,
min_row=2,
max_row=13)
# Create object of BarChart class
chart = BarChart()
chart.add_data(values, titles_from_data=True)
chart.set_categories(cats)
# set the title of the chart
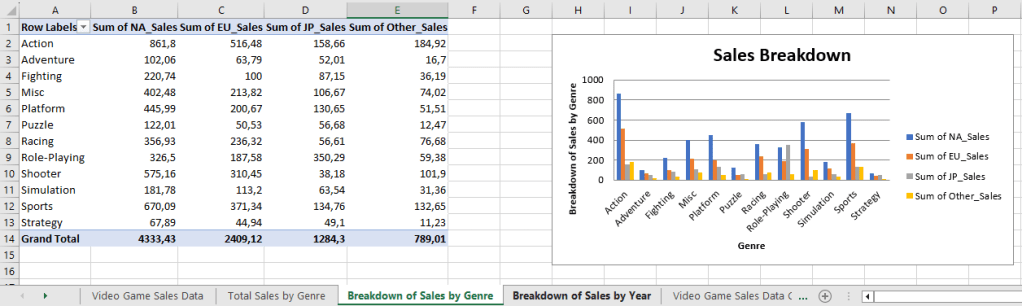
chart.title = "Sales Breakdown"
# set the title of the x-axis
chart.x_axis.title = "Genre"
# set the title of the y-axis
chart.y_axis.title = "Breakdown of Sales by Genre"
# the top-left corner of the chart is anchored to cell H2.
ws.add_chart(chart,"H2")
# save the file
wb.save("videogamesales.xlsx")
Output:
- Grouped Line Chart
Let’s create a stacked line chart using data in the tab “Breakdown of Sales by Year.” This worksheet contains video game sales data broken down by year and region:
# Data for plotting

values = Reference(ws,
                   min_col=2,
                   max_col=6,
                   min_row=1,
                   max_row=40)

cats = Reference(ws, min_col=1, max_col=1, min_row=2, max_row=40)
# Create object of LineChart class

from openpyxl.chart import LineChart

chart = LineChart()
chart.add_data(values, titles_from_data=True)
chart.set_categories(cats)

# set the title of the chart
chart.title = "Total Sales"

# set the title of the x-axis
chart.x_axis.title = "Year"

# set the title of the y-axis
chart.y_axis.title = "Total Sales by Year"

# the top-left corner of the chart is anchored to cell H2
ws.add_chart(chart,"H2")

# save the file
wb.save("videogamesales.xlsx")
Output:

Formatting Cells
- Openpyxl allows users to format cells in Excel workbooks by changing font sizes, background colors, and cell borders directly in Python.
- Read more various ways to customize your Python Excel spreadsheets using Openpyxl.
Conclusions
- This study shows how to automate your day-day MS Excel tasks using Pandas and Openpyxl Python.
- Openpyxl is a Python library that is used to read from an Excel file or write to an Excel file.
- Data scientists use Openpyxl for data analysis, data copying, data mining, drawing charts, styling sheets, adding formulas, and more.
- We have considered Excel spreadsheet I/O, working with Excel formulas, cell manipulations, and a few basic Excel charts.
- However, not all features of Excel automation are supported via Openpyxl, such as filtering and Pivot tables.
- To access advanced features such as running macros and converting Excel to PDFs, one can combine Openpyxl with other libraries such as win32com python client or xlwings for an extended version of Excel automation using Python.
References
- Introduction to Excel in Python
- How to Automate an Excel Sheet in Python?
- Chapter 12 – Working with Excel Spreadsheets
- Master Guide for Excel Automation Using Python
- EXCEL AUTOMATION WITH OPENPYXL IN PYTHON
- Automate Excel Reporting Using Python
- Build Excel Automation Tools with Python
Explore More


Make a one-time donation
Make a monthly donation
Make a yearly donation
Choose an amount
Or enter a custom amount
Your contribution is appreciated.
Your contribution is appreciated.
Your contribution is appreciated.
DonateDonate monthlyDonate yearly
Leave a comment