
Featured Photo by Pixabay
- The goal of this post is to perform a comprehensive QC assessment of the best selected growth stocks in Q1’23. These stocks are A (Strong Buy) rated in the POWR Ratings system. The POWR Ratings assess stocks by 118 different factors, each with its own weighting.
- It is important to verify the A-score in a comparative technical analysis of two independent digital stock screeners such as TradingView and the Python Algo Trading algorithm.
- Today we look at LSI Industries Inc. (LYTS). The company engages in the provision a variety of lighting solutions. It operates through the following business segments: Lighting and Graphics. The Lighting segment manufactures and markets outdoor and indoor lighting for the commercial, industrial and multi-site retail markets, including the petroleum or convenience store market. The Graphics segment fabricates and sells exterior and interior visual image elements related to graphics. The company was founded by Robert J. Ready, James P. Sferra, and Donald E. Whipple in 1976 and is headquartered in Cincinnati, OH.
Table of Contents
- SeekingAlpha
- StockNews
- TradingView
- The 1-week technical analysis summary for LSI Industries Inc
- Algo-Trading
- Summary
- Explore More
SeekingAlpha
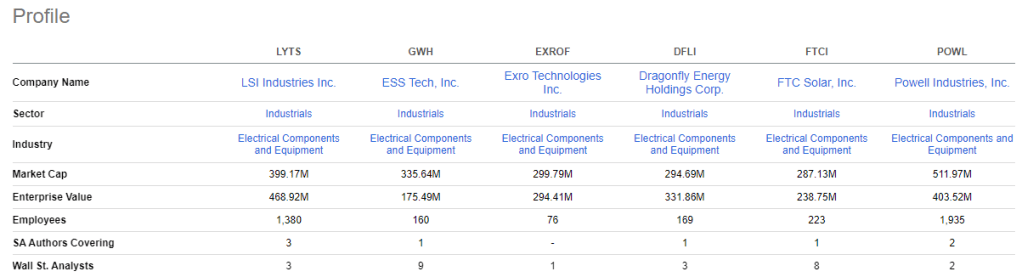
The peer-to-peer LYTS comparison table is as follows
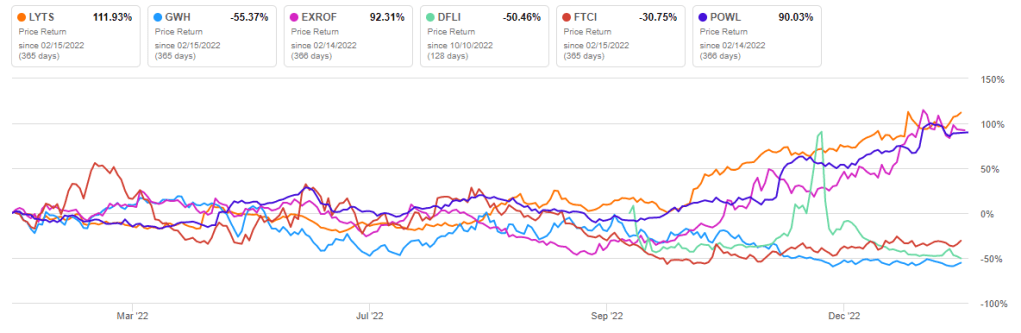
with the 1Y price return chart
LSI Industries: Impressive Q1 Results With Significant Growth Prospects
StockNews
- LYTS produces and sells non-residential lighting and retail display solutions in the United States, Canada, Mexico, Australia, and Latin America. It operates in two segments, Lighting, and Display Solutions.
- LYTS’ forward EV/Sales of 0.91x is 49.1% lower than the industry average of 1.79x. Its forward Price/Sales of 0.77x is 45.6% lower than the industry average of 1.42x.
- Its trailing-12-month ROCE and ROTC of 14.31% and 8.46% are 2.2% and 25.1% higher than the industry averages of 13.99% and 6.76%.
- LYTS’ net sales came in at $128.80 million for the quarter that ended December 31, 2022, up 15.9% year-over-year.
- Its adjusted EBITDA increased 54% year-over-year to $12.98 billion.
- Also, its EPS came in at $0.26, up 73.3% year-over-year.
- LYTS’ revenue is expected to increase 9.2% year-over-year to $496.88 million for the current fiscal year 2023.
- Its EPS is expected to rise 32.8% year-over-year to $0.85 in 2023. It surpassed EPS estimates in all four trailing quarters.
- Over the past year, the stock gained 98.6% to close the last trading session at $14.10.
- LYTS has an overall A rating, equating to a Strong Buy in our POWR Ratings system.
- It has an A grade for Value and Sentiment and a B for Quality.
- It is ranked #3 out of 91 stocks in the B-rated Industrial – Equipment industry.
- To see Growth, Momentum, and Stability and Quality ratings for LYTS, click here.
TradingView
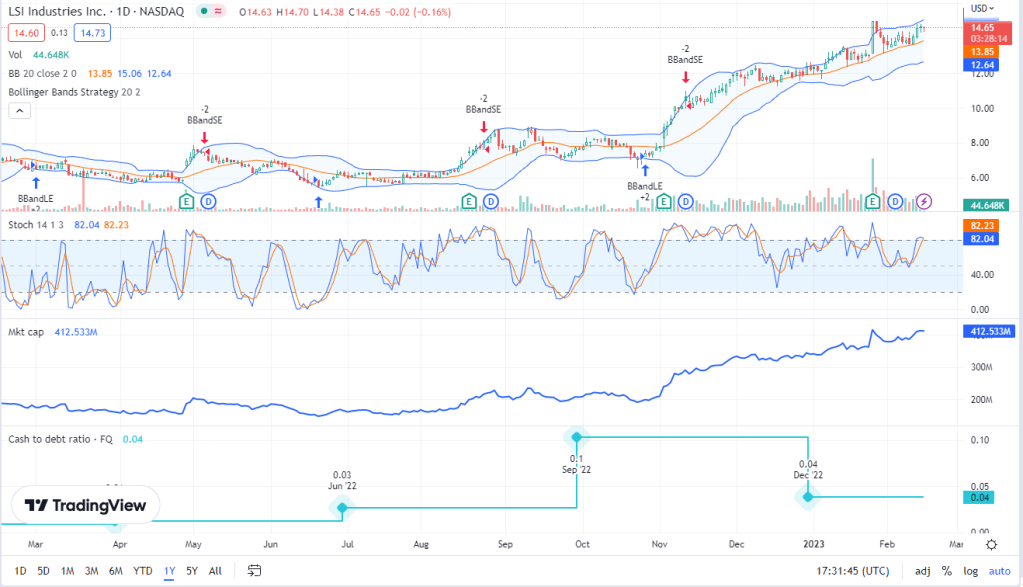
1Y LYTS stock price USD with Bollinger Bands strategy, Stochastic Oscillator (SO) and the market cap (MC).
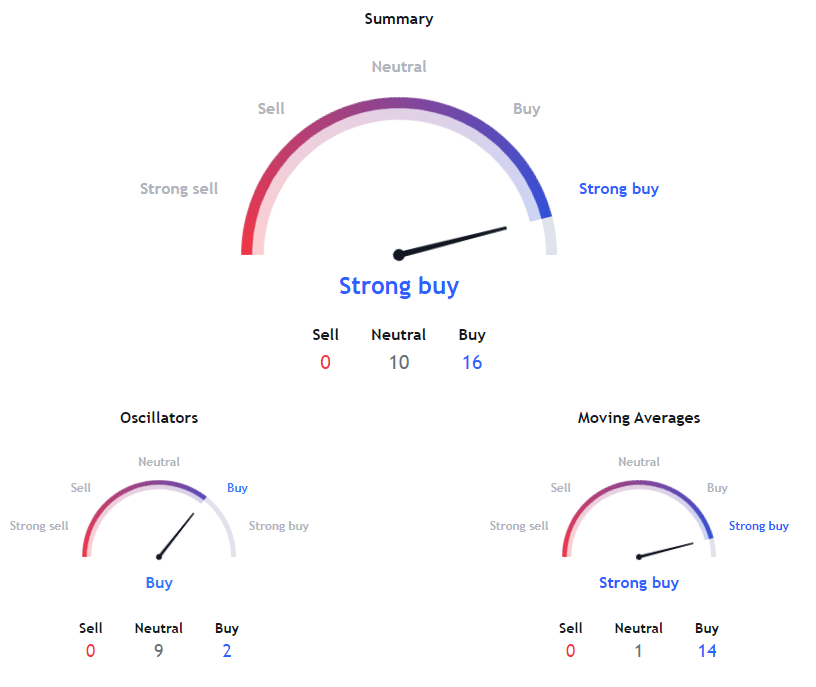
The 1-week technical analysis summary for LSI Industries Inc:
This gauge displays a real-time technical analysis overview for your selected timeframe. The summary of LSI Industries Inc is based on the most popular technical indicators, such as Moving Averages, Oscillators and Pivots.
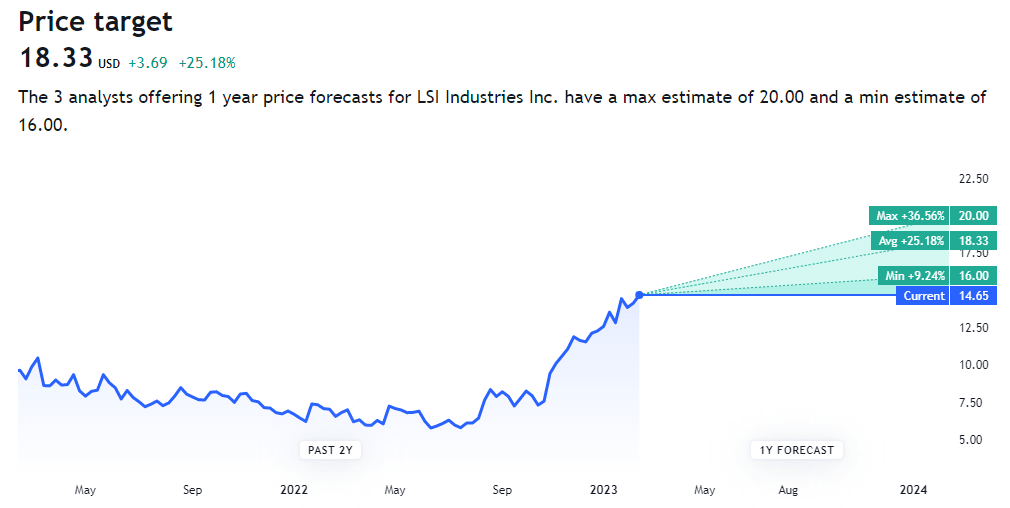
LYTS 1Y forecast with the predicted average annual growth of ~25%.

Algo-Trading
- IMPORTING PACKAGES
import numpy as np
import requests
import pandas as pd
import matplotlib.pyplot as plt
from math import floor
from termcolor import colored as cl
plt.style.use(‘fivethirtyeight’)
plt.rcParams[‘figure.figsize’] = (20,10)
- EXTRACTING STOCK DATA
def get_historical_data(symbol, start_date):
api_key = ‘a07d718849d64be78e8a7d5669e4e3af’
api_url = f’https://api.twelvedata.com/time_series?symbol={symbol}&interval=1day&outputsize=5000&apikey={api_key}’
raw_df = requests.get(api_url).json()
df = pd.DataFrame(raw_df[‘values’]).iloc[::-1].set_index(‘datetime’).astype(float)
df = df[df.index >= start_date]
df.index = pd.to_datetime(df.index)
return df
googl = get_historical_data(‘LYTS’, ‘2022-01-01’)
googl.tail()

- DISPARITY INDEX CALCULATION
def get_di(data, lookback):
ma = data.rolling(lookback).mean()
di = ((data – ma) / ma) * 100
return di
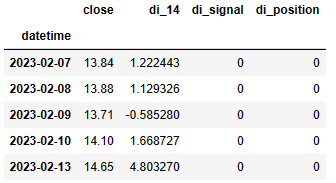
googl[‘di_14’] = get_di(googl[‘close’], 14)
googl = googl.dropna()
googl.tail()

- DISPARITY INDEX STRATEGY
def implement_di_strategy(prices, di):
buy_price = []
sell_price = []
di_signal = []
signal = 0
for i in range(len(prices)):
    if di[i-4] < 0 and di[i-3] < 0 and di[i-2] < 0 and di[i-1] < 0 and di[i] > 0:
        if signal != 1:
            buy_price.append(prices[i])
            sell_price.append(np.nan)
            signal = 1
            di_signal.append(signal)
        else:
            buy_price.append(np.nan)
            sell_price.append(np.nan)
            di_signal.append(0)
    elif di[i-4] > 0 and di[i-3] > 0 and di[i-2] > 0 and di[i-1] > 0 and di[i] < 0:
        if signal != -1:
            buy_price.append(np.nan)
            sell_price.append(prices[i])
            signal = -1
            di_signal.append(signal)
        else:
            buy_price.append(np.nan)
            sell_price.append(np.nan)
            di_signal.append(0)
    else:
        buy_price.append(np.nan)
        sell_price.append(np.nan)
        di_signal.append(0)

return buy_price, sell_price, di_signal
buy_price, sell_price, di_signal = implement_di_strategy(googl[‘close’], googl[‘di_14’])
- DISPARITY INDEX TRADING SIGNALS PLOT
ax1 = plt.subplot2grid((11,1), (0,0), rowspan = 5, colspan = 1)
ax2 = plt.subplot2grid((11,1), (6,0), rowspan = 5, colspan = 1)
ax1.plot(googl[‘close’], linewidth = 2, color = ‘#1976d2’)
ax1.plot(googl.index, buy_price, marker = ‘^’, markersize = 12, linewidth = 0, label = ‘BUY SIGNAL’, color = ‘green’)
ax1.plot(googl.index, sell_price, marker = ‘v’, markersize = 12, linewidth = 0, label = ‘SELL SIGNAL’, color = ‘r’)
ax1.legend()
ax1.set_title(‘LYTS CLOSING PRICES’)
for i in range(len(googl)):
if googl.iloc[i, 5] >= 0:
ax2.bar(googl.iloc[i].name, googl.iloc[i, 5], color = ‘#26a69a’)
else:
ax2.bar(googl.iloc[i].name, googl.iloc[i, 5], color = ‘#ef5350’)
ax2.set_title(‘LYTS DISPARITY INDEX 14’)
plt.show()

- STOCK POSITION
position = []
for i in range(len(di_signal)):
if di_signal[i] > 1:
position.append(0)
else:
position.append(1)
for i in range(len(googl[‘close’])):
if di_signal[i] == 1:
position[i] = 1
elif di_signal[i] == -1:
position[i] = 0
else:
position[i] = position[i-1]
close_price = googl[‘close’]
di = googl[‘di_14’]
di_signal = pd.DataFrame(di_signal).rename(columns = {0:’di_signal’}).set_index(googl.index)
position = pd.DataFrame(position).rename(columns = {0:’di_position’}).set_index(googl.index)
frames = [close_price, di, di_signal, position]
strategy = pd.concat(frames, join = ‘inner’, axis = 1)
strategy.tail()
- BACKTESTING
googl_ret = pd.DataFrame(np.diff(googl[‘close’])).rename(columns = {0:’returns’})
di_strategy_ret = []
for i in range(len(googl_ret)):
returns = googl_ret[‘returns’][i]*strategy[‘di_position’][i]
di_strategy_ret.append(returns)
di_strategy_ret_df = pd.DataFrame(di_strategy_ret).rename(columns = {0:’di_returns’})
investment_value = 10000
number_of_stocks = floor(investment_value/googl[‘close’][0])
di_investment_ret = []
for i in range(len(di_strategy_ret_df[‘di_returns’])):
returns = number_of_stocks*di_strategy_ret_df[‘di_returns’][i]
di_investment_ret.append(returns)
di_investment_ret_df = pd.DataFrame(di_investment_ret).rename(columns = {0:’investment_returns’})
total_investment_ret = round(sum(di_investment_ret_df[‘investment_returns’]), 2)
profit_percentage = floor((total_investment_ret/investment_value)*100)
print(cl(‘Profit gained from the LYTS strategy by investing $10k in LYTS : {}’.format(total_investment_ret), attrs = [‘bold’]))
print(cl(‘Profit percentage of the LYTS strategy : {}%’.format(profit_percentage), attrs = [‘bold’]))
Profit gained from the LYTS strategy by investing $10k in LYTS : 8115.0
Profit percentage of the LYTS strategy : 81%
- SPY ETF COMPARISON
def get_benchmark(start_date, investment_value):
spy = get_historical_data(‘SPY’, start_date)[‘close’]
benchmark = pd.DataFrame(np.diff(spy)).rename(columns = {0:’benchmark_returns’})
investment_value = investment_value
number_of_stocks = floor(investment_value/spy[-1])
benchmark_investment_ret = []

for i in range(len(benchmark['benchmark_returns'])):
    returns = number_of_stocks*benchmark['benchmark_returns'][i]
    benchmark_investment_ret.append(returns)

benchmark_investment_ret_df = pd.DataFrame(benchmark_investment_ret).rename(columns = {0:'investment_returns'})
return benchmark_investment_ret_df
benchmark = get_benchmark(‘2022-01-01’, 10000)
investment_value = 10000
total_benchmark_investment_ret = round(sum(benchmark[‘investment_returns’]), 2)
benchmark_profit_percentage = floor((total_benchmark_investment_ret/investment_value)*100)
print(cl(‘Benchmark profit by investing $10k : {}’.format(total_benchmark_investment_ret), attrs = [‘bold’]))
print(cl(‘Benchmark Profit percentage : {}%’.format(benchmark_profit_percentage), attrs = [‘bold’]))
print(cl(‘LYTS Strategy profit is {}% higher than the Benchmark Profit’.format(profit_percentage – benchmark_profit_percentage), attrs = [‘bold’]))
Benchmark profit by investing $10k : -1566.12
Benchmark Profit percentage : -16%
LYTS Strategy profit is 97% higher than the Benchmark Profit
Summary
- StockNews: LYTS has an overall A rating, equating to a Strong Buy in the POWR Ratings system.
- TradingView: STRONG BUY weekly summary based on the most popular technical indicators, such as Moving Averages, Oscillators and Pivots; predicted 1Y average growth of ~25%.
- Algo-Trading DI Backtesting: Profit gained from the LYTS strategy by investing $10k in LYTS is $8115.0; profit percentage of the LYTS strategy is 81%.
- Algo-Trading DI SPY ETF COMPARISON: Benchmark profit by investing $10k is -$1566.12; Benchmark Profit percentage is -16%; LYTS Strategy profit is 97% higher than the Benchmark Profit.
Explore More
A Comparative Analysis of The 3 Best Global Growth Stocks in Q1’23 – 2. AZN
A Comparative Analysis of The 3 Best U.S. Growth Stocks in Q1’23 – 1. WMT


Make a one-time donation
Make a monthly donation
Make a yearly donation
Choose an amount
Or enter a custom amount
Your contribution is appreciated.
Your contribution is appreciated.
Your contribution is appreciated.
DonateDonate monthlyDonate yearly
Leave a comment